

Last Updated on August 22, 2026
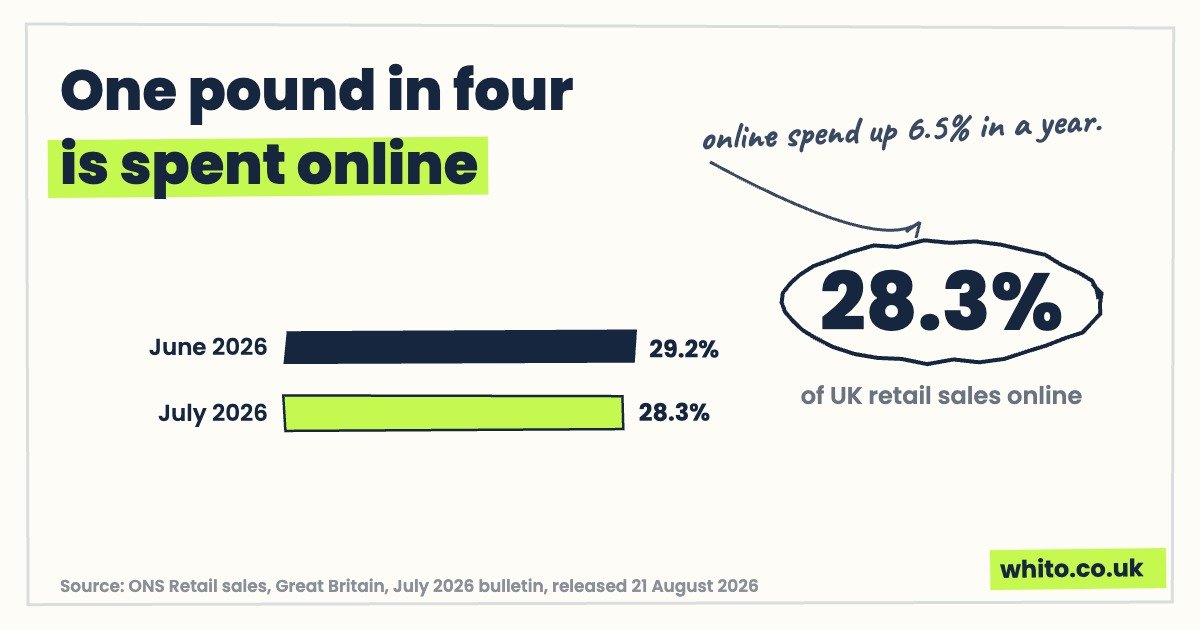
More than one pound in every four spent in UK retail now goes through a website. That is the official ONS figure for July 2026, and it is not a blip. The online share has sat near record post-pandemic levels all year.
Here is the part most owners get wrong. They treat “get online” as the finish line. Build the shop, connect the payment gateway, done.
The numbers below tell a different story. Overall online growth is flat to modest, the growth that does exist is concentrated in specific categories, second-hand marketplaces are taking a serious bite out of new-goods spending, and delivery problems plus returns are quietly eating the margin on every order.
Being online is the entry fee. Profit comes from what you do after that. This page pulls together the verified UK ecommerce numbers, with sources and dates on every figure, so you can plan from evidence rather than headlines. It sits alongside our reports on UK website and digital adoption statistics and UK social media statistics.
Key UK ecommerce statistics
- 28.3% of retail sales in Great Britain were made online in July 2026 (ONS, released 21 August 2026)
- Online spending values were 6.5% higher than in July 2025, while total retail moved far less (ONS, July 2026)
- UK business ecommerce sales were £668.9 billion in 2019, the last time the official survey was run (ONS, published 2021)
- 87% of GB adults had shopped online in the previous 12 months by early 2020, up from 53% in 2008, series since discontinued (ONS)
- 90% of UK online adults visit Amazon in a month (Ofcom Online Nation 2025)
- 64% of the UK’s 48.8 billion payments in 2024 were made by card (UK Finance, 2025)
- Vinted holds 50-60% of UK consumer-to-consumer online apparel marketplace sales (CMA, July 2026)
- UK parcel volumes hit 4.2 billion items in 2024-25, up 7.1% (Ofcom, December 2025)
- £25.1 billion of non-food items were forecast to be returned in 2025 (Retail Economics with ZigZag)
- IMRG expects 0% growth for the online retail market in 2026 (IMRG, February 2026)
How much UK retail happens online now
28.3% of retail sales in Great Britain were made online in July 2026, per the ONS retail sales bulletin released on 21 August 2026. The ONS bulletin is the most reliable measure of UK online retail, so this is as fresh as official data gets.
The proportion of retail sales made online was 28.3% in July 2026. That was down from 29.2% in June 2026, but June had spiked to the highest share in over five years, so July is an easing from a peak, not a slump.
Source: ONS Retail Sales, Great Britain, July 2026 bulletin, released 21 August 2026. Base: all GB retail sales.
Two things matter here for a business owner.
First, the online share has hovered near record post-pandemic levels through 2026. This is not a lockdown hangover that is unwinding. Online is now a structural quarter-plus of retail.
Second, online spending values were 6.5% higher than in July 2025 while total retail moved far less. In other words, what growth exists in retail is disproportionately happening on websites, not on the high street.
The mistake is reading that as “online is booming, just launch and the orders will come”. As the industry forecasts later in this page show, the value growth is uneven and hard-won. The share is high because online keeps taking spend from offline, not because the whole pie is expanding quickly.
The size of the machine underneath
Nobody has an up-to-date official figure for what UK ecommerce is worth in total, and you should be suspicious of any page that quotes one without a date.
The last official measure is the ONS E-commerce and ICT activity survey covering 2019, published in February 2021. It has not been run since. Those 2019 figures are still worth knowing because they show the scale of the machine, as long as you treat them as a dated baseline rather than a current number.
Source: ONS E-commerce and ICT activity survey, 2019 data, published February 2021. Base: UK businesses with 10 or more employees. Includes B2B and EDI sales, not just consumer shopping.
In 2019, UK business e-commerce sales were £668.9 billion. That figure includes business-to-business trade and EDI ordering systems, so it is far bigger than consumer online shopping. Website sales specifically were £334.9 billion.
The same survey found that only 25.2% of businesses with 10 or more employees received website orders. Roughly three in four sizeable UK businesses did not sell through their own website, as of the last time anyone officially counted.
On the customer side, the ONS internet access survey found that 87% of GB adults had shopped online in the previous 12 months, up from 53% in 2008. That fieldwork was done in early 2020 and the series has since been discontinued, so treat it as the last known reading, not today’s figure.
Ofcom’s Online Nation 2025 report fills in the behavioural picture. UK adults now average 4 hours 30 minutes a day online, smartphones account for 77% of time spent online, and Amazon is visited by 90% of UK online adults in a month. Note that the smartphone figure is about time online, not sales. There is no verified figure for mobile’s share of UK ecommerce sales, so ignore anyone quoting one with confidence.
Only one in four UK businesses with ten or more staff took website orders the last time it was officially measured. The gap between shoppers who buy online and businesses set up to sell online is still where the opportunity sits.
How people pay
Checkout friction kills conversion, so it pays to know how UK customers actually pay. UK Finance’s Payment Markets Report 2025 covers 2024 data and counts all UK payments, not just online ones, but the direction of travel is unmistakable.
Source: UK Finance Payment Markets Report 2025, 2024 data. Base: all UK payments and UK adults, not online payments only. First two bars are shares of the 48.8 billion payments made in 2024; last two are shares of UK adults.
The UK made 48.8 billion payments in 2024. Cards took 64% of them, and 39% of all payments were contactless. Debit cards alone made 26.1 billion payments, half of everything.
Meanwhile 88% of UK adults used remote banking, and 50% used mobile contactless wallets such as Apple Pay or Google Pay at least monthly.
The practical read for an online shop is simple. Debit cards are the default, and wallet payments are now a mainstream habit for half of adults. If your checkout does not offer Apple Pay and Google Pay alongside cards, you are adding typing friction for a customer who is used to paying with a thumbprint.
Marketplaces and the second-hand shift
One of the most striking verified findings of 2026 came from an unlikely place, the Competition and Markets Authority’s July 2026 decision on the eBay and Depop merger. Its scope is narrow, UK consumer-to-consumer online apparel marketplaces only, but within that scope the numbers are stark.
Source: CMA decision on the eBay/Depop merger, July 2026. Base: UK consumer-to-consumer online apparel marketplace sales by gross merchandise value. The CMA publishes ranges, not exact shares; bars are drawn at range midpoints.
Vinted holds 50-60% of UK consumer-to-consumer online apparel marketplace sales by gross merchandise value. eBay sits at 10-20%, Facebook Marketplace at 5-10% and Depop at 0-5%.
Just as important, the CMA found that this second-hand apparel market grew roughly 50-60% between 2021 and 2025. While new-clothing online sales are forecast to shrink, as the IMRG figures below show, second-hand is one of the few corners of UK ecommerce with genuine momentum.
If you sell clothing, footwear or accessories, the second-hand shift is not a curiosity. It is a competitor for the same wardrobe budget, and it partly explains why the clothing category is forecast to fall while the overall online share stays high.
Delivery and returns, the margin eaters
Here is where “get online and you are done” thinking costs real money. The sale is not the end of the transaction. The parcel has to arrive, and increasingly, it has to come back.
Ofcom’s post monitoring report for 2024-25, published in December 2025, puts UK parcel volumes at 4.2 billion items, up 7.1% on the year. Yet operator revenues were £13.2 billion, down 0.8% in real terms. More parcels, less real revenue for the carriers, which tells you the price pressure running through the whole delivery chain.
Quality is a problem too. In Ofcom’s companion survey of 4,058 people, 68% experienced a parcel delivery issue in 2025. Two in three of your customers have a recent delivery frustration in mind when they decide whether to trust your shop.
Then there are returns. The Retail Economics and ZigZag returns benchmark for 2025, an industry estimate weighted towards fashion, is built on 100 audited returns journeys at leading UK clothing and footwear retailers plus a 2,000-consumer survey.
| Returns measure | Figure | Note |
|---|---|---|
| Non-food items forecast to be returned in 2025 | £25.1bn | Down from £26.7bn in 2024 |
| Overall returns rate | 19.5% | Easing from 21% |
| Retailers charging for returns | 42% | Of retailers in the benchmark |
| Retailers offering totally free returns | 24 of 100 | Audited returns journeys |
| Consumers who say a choice of returns channels matters | 76% | 2,000-consumer survey |
Source: Retail Economics with ZigZag, UK returns benchmark 2025. Industry estimate, fashion-weighted: 100 audited returns journeys at leading UK clothing and footwear retailers plus a 2,000-consumer survey.
£25.1 billion of non-food items were forecast to be returned in 2025. The rate is easing, from 21% to 19.5%, and retailers are pushing back on cost, with 42% now charging for returns and only 24 of the 100 audited retailers offering totally free returns.
But customers have not stopped caring. 76% say a choice of returns channels matters to them. The market is settling into a middle ground, returns that are easy but not always free.
For a small shop the maths is brutal. A returned item carries the outbound postage, often the return postage, the repacking time and sometimes a product you can no longer sell at full price. On a 19.5% returns rate, a fifth of your fulfilment effort earns nothing. Cutting your returns rate by even a few points, through better size guides, honest photography and clearer descriptions, often does more for profit than any advertising campaign.
A fifth of what a typical non-food retailer ships comes back. The cheapest return is the one your product page prevented.
What the industry expects
If the ONS says online spending values are 6.5% up on a year ago, why is the industry gloomy? Because the trade body IMRG, whose Online Retail Index tracks a panel of online retailers’ revenue, expects 0% growth for the online retail market in 2026, and its January 2026 reading was down 3.7% year on year.
These two sources are not contradicting each other so much as measuring different things. ONS measures all online spending across retail. IMRG measures revenue across its panel of online retailers. Money moving towards marketplaces, second-hand platforms and retailers outside the panel can lift one measure while flattening the other. Neither is wrong, they just answer different questions, which is exactly why we cite both.
Underneath IMRG’s flat headline, the category forecasts point in sharply different directions.
Source: IMRG Online Retail Index expectations for 2026, published February 2026. Base: IMRG’s panel of online retailers. Bar lengths show the size of the expected move; the clothing bar represents a fall.
Clothing is forecast to fall 4%, health and beauty to grow 5%, and sports and outdoors to grow 8%. That 12-point spread between the best and worst categories is the real story. “Is UK ecommerce growing?” is the wrong question. “Is my category growing, and where is the spend going instead?” is the right one.
Put the CMA and IMRG findings side by side and the picture sharpens. New clothing sold online is expected to shrink while the second-hand apparel market has grown 50-60% since 2021. The demand has not vanished. It has moved.
What this means for your online shop
Pulling the verified numbers together, here is the practical read for a UK small business.
1. Online is table stakes, not a strategy. With 28.3% of retail sales online and 90% of online adults visiting Amazon monthly, your customers are already buying online. Simply existing there earns you nothing. Your positioning, offer and product pages do the earning. Our UK website statistics report covers how far UK small firms have actually got with the basics.
2. Plan for flat, fight for share. IMRG expects 0% market growth in 2026. In a flat market, your growth comes from someone else’s customers, which means clarity and conversion beat spend. Fix the shop before you fund the ads.
3. Check your category before you set targets. An 8% tailwind in sports and outdoors and a 4% headwind in clothing produce very different plans on the same budget.
4. Treat delivery and returns as profit lines, not admin. With 68% of people hitting a delivery issue in 2025 and a 19.5% returns rate on non-food, the post-purchase experience is where margin leaks and where trust is won. Measure your own returns rate. Most small shops never have.
5. Match your checkout to how Britain pays. Debit cards made half of all UK payments and half of adults use mobile wallets monthly. Offer both, and remove every unnecessary field.
More of our evidence-based reports live in the Whito research hub.
Methodology and sources
Every figure on this page comes from a named source with a date. Where a figure is old or the series has ended, we say so. Sources are labelled official (government or regulator), industry (trade body) or commercial.
- ONS Retail Sales, Great Britain, official. July 2026 bulletin, released 21 August 2026. Online share of retail sales and online spending values.
- ONS E-commerce and ICT activity survey, official. 2019 data, published February 2021, the latest edition ever run. Business e-commerce and website sales values.
- ONS Internet access survey, official. Fieldwork early 2020, series since discontinued. Share of adults shopping online.
- Ofcom Online Nation 2025, official. Ipsos iris data, UK online adults, May 2025. Time online, smartphone share of time, Amazon reach.
- UK Finance Payment Markets Report 2025, industry body. 2024 data, all UK payments, not just online. Payment volumes and methods.
- CMA decision on the eBay/Depop merger, official. July 2026. UK consumer-to-consumer online apparel marketplace shares, published as ranges.
- Ofcom post monitoring report 2024-25, official. Published December 2025. Parcel volumes and revenues, plus a companion survey of 4,058 people on delivery issues.
- Retail Economics with ZigZag returns benchmark 2025, commercial. Industry estimate, fashion-weighted: 100 audited returns journeys plus a 2,000-consumer survey.
- IMRG Online Retail Index expectations for 2026, industry body. Published February 2026. Growth forecast and category expectations from IMRG’s retailer panel.
Known limits. The last official measure of the share of UK businesses selling online is from 2019, because the ONS e-commerce survey has not been run since. The ONS series on the share of adults shopping online was discontinued, with the last figure from 2020, so no current official figure exists for either measure and the dated figures on this page should not be read as current. There is also no verified figure for mobile’s share of UK ecommerce sales, only Ofcom’s figure for share of time online. Finally, ONS and IMRG measure different things, all online spending versus a panel of online retailers’ revenue, so their growth figures can point in different directions and should not be averaged or swapped for one another.
How to cite this page
Whito, “UK Ecommerce Statistics 2026”, whito.co.uk, updated 21 August 2026. Reuse of the figures and charts is permitted with attribution and a link to this page.
Frequently asked questions
What percentage of UK retail sales are online in 2026?
28.3% of retail sales in Great Britain were made online in July 2026, according to the ONS bulletin released on 21 August 2026. That was down from 29.2% in June 2026, which had been the highest share in over five years.
How much is UK ecommerce worth in total?
There is no current official total. The last official measure is the ONS e-commerce survey for 2019, which put UK business e-commerce sales at £668.9 billion for businesses with 10 or more employees, including B2B and EDI, with £334.9 billion of that through websites. The survey has not been run since, so treat any newer total with caution.
Is UK online shopping still growing?
It depends on the measure. ONS data shows online spending values 6.5% higher in July 2026 than a year earlier, while the trade body IMRG expects 0% growth for the online retail market in 2026 across its retailer panel. They measure different things, and growth varies sharply by category, with sports and outdoors forecast up 8% and clothing down 4%.
How do most UK customers pay?
By card. Of the 48.8 billion UK payments made in 2024, 64% were by card and 39% were contactless, with debit cards alone making 26.1 billion payments, half of all payments. Half of UK adults also used mobile contactless wallets such as Apple Pay or Google Pay at least monthly, according to UK Finance.
How big a problem are returns for UK online retailers?
Substantial. Retail Economics and ZigZag forecast £25.1 billion of non-food items would be returned in 2025, with the overall returns rate easing from 21% to 19.5%. 42% of retailers now charge for returns, while 76% of consumers say having a choice of returns channels matters to them.
The takeaway
UK ecommerce in 2026 is big, mature and flat. More than a quarter of retail spending is online, but the market as a whole is not expected to grow this year, and the growth that exists is concentrated in specific categories and in second-hand marketplaces.
That changes what winning looks like. The shops that profit will not be the ones that spend the most getting visitors. They will be the ones that convert the visitors they get, pick categories with a tailwind, take payments the way Britain actually pays, and stop a fifth of their stock coming back through the letterbox.
Being online was the finish line in 2015. In 2026 it is the starting line, and the race is won on structure, not spend.
The structural checks behind this research run on any website in about twenty seconds. Enter yours and read the full result on the page. Free, and we do not ask for your email.
Check your business freeIf your business is named here and you think we have a fact wrong, email hello@whito.co.uk and we will check it and correct it. If you want to respond, send us a statement and we will publish it alongside. Full detail: Corrections, right of reply and removals.