
Last Updated on November 13, 2026
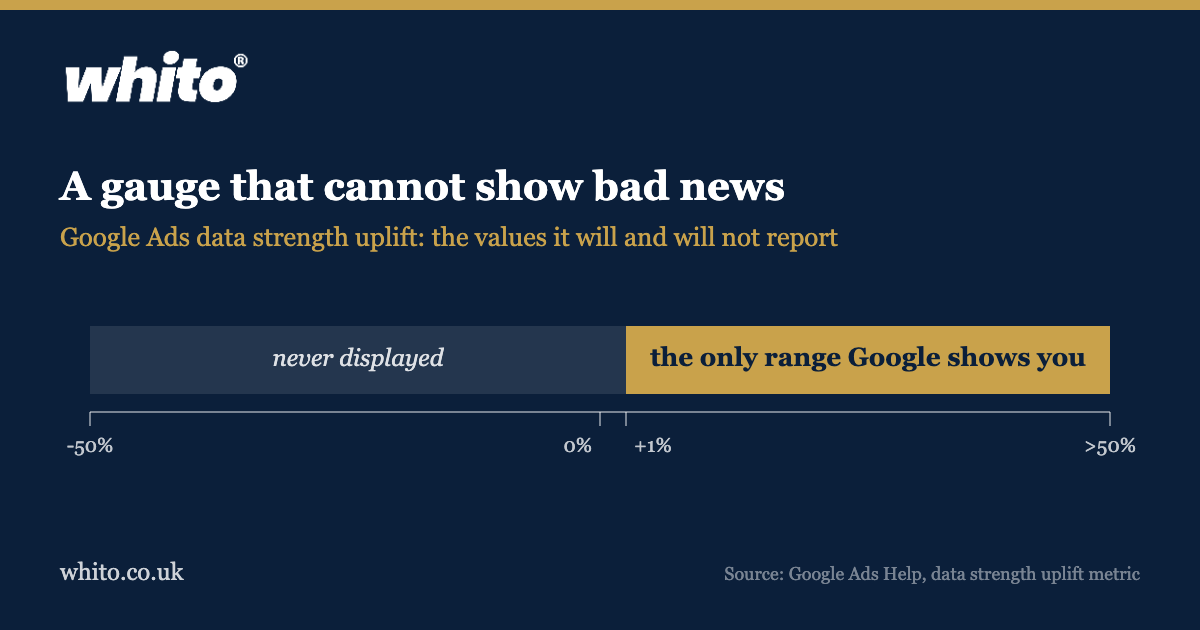
Google has started grading its own tracking for you. There is now a number in your Google Ads account that tells you how many extra conversions your first-party data setup earned. It sounds like accountability. Read the rules and it is closer to a scoreboard that only lights up when the home team is ahead.
Google published the detail behind its data strength uplift metric this week. The metric itself was announced on 10 September. The help page is the first place the rules are written down, and the rules are the story.
The mistake most owners will make
The mistake is reading this number as proof your advertising got better. It is not that. It is a report on your plumbing.
Google’s own wording is precise, and the precision is worth noticing. The metric “estimates the percentage of additional conversions reported over the past 14 days”. Reported. Not won, not earned, not banked. The feature finds sales that already happened and that the old tag missed. The money was already in your account. What changed is the credit.
That distinction is the whole post. A business that goes from counting 80 sales to counting 95 sales has not sold anything more. It has stopped losing sight of fifteen of them. Useful for deciding where to put next month’s budget. Useless as evidence of growth.
Here is the part that should make you sit up. Google says the uplift is displayed when the estimated lift is “+1% or higher”, and that displayed values run “from +1% up to >50%”.
So there is no card for zero. There is no card for a decline. A setup that is doing nothing for you looks identical to a setup Google has no opinion about. The only outcome the metric can report is one that argues for the feature it is measuring.
That is not a conspiracy. Google calls the figure “a directional percentage increase over your baseline conversions”, and directional is an honest word. But a one-way gauge is a marketing asset before it is a measurement one, and you should price it accordingly.
What the headline percentages actually compare
Google’s announcement carried four uplift figures. Every one has a footnote, and the footnotes are more interesting than the numbers.
| Google’s figure | What the footnote says it compares |
|---|---|
| 14% average conversion uplift from Google tag gateway | “Google Internal Data, Global, Finance, July -Dec 2024 vs Jan-June 2025”. One vertical, and two different half-years set against each other. |
| 11% more Search conversions from enhanced conversions | “standard conversion imports vs. Enhanced Conversions on imported conversions”, 1 to 14 January 2026. A fortnight of data. |
| 26% increase in incremental ROAS from Data Manager | “Based on Search campaigns bidding to conversion value”, April 2025 to April 2026. No comparison group named. |
| Over 20% uplift for Demand Gen | “Google Data, Global, Performance, June 3, 2026, – Jun 17, 2026”. A date range, no baseline stated. |
None of those is a forecast for your account. The 14% headline, the one most agencies will quote at you, comes from finance firms and from comparing one six-month block to the next. If you fit sheet metal in Dudley, it tells you nothing. This is the same habit we found when we read the UK’s SEO cost guides and discovered only one in ten shows its working. A number with no stated comparison is a claim, not evidence.
Most UK small businesses will never see the card at all
There is a volume gate. Google requires at least 100 conversions in 14 days for online website actions, or 20 conversions in 14 days for offline actions. Newly switched-on features need at least 30 days before a reliable estimate appears. The metric runs on a rolling 14-day window and refreshes daily.
A hundred website conversions a fortnight is a real business doing real volume. Plenty of profitable UK firms, the ones selling a 4,000 pound job twice a month, are nowhere near it. If you are one of them, the card will stay blank, and a blank card means nothing at all. It is not a verdict on your setup.
Worth knowing: web-only enhanced conversions are not included in this first rollout, and conversions imported from Google Analytics or Floodlight will not show the card either. If your tracking runs through Analytics, this metric is not looking at you.
What to do with this
Three things, in order.
One. Fix the plumbing anyway. Accurate conversion tracking is a Build-stage job and it is worth doing on its own merits. Ads that can see which enquiries turned into money spend better. Just do not file the improvement under sales growth.
Two. Keep one number outside Google. Invoiced revenue, month by month, from your own books. Platform metrics change their definitions. Your accounts do not. We take the same line on every tool claim, which is why our work on what AI can actually save a UK business starts from measured hours rather than vendor estimates.
Three. Check what else is moving on its own. Google changes plenty inside accounts without an invitation, and our guide to what Google can change in your Google Ads account without asking is the place to start. Do that before you read anything into your figures this month, because the November core update is also still rolling and your numbers will be noisy until December.
The takeaway
A gauge that cannot show bad news is not a gauge. Treat the uplift percentage as what it is, a prompt to tidy your tracking, and keep judging your advertising on the only figure that does not get redefined by a platform release note: money in the bank at the end of the month.