
Finding
UK advertising investment reached £46.7 billion in 2025, up 6.4% year on year, and £1 of advertising returns £4.11 in profit for medium and large firms but £1.89 for micro and small firms, per AA/WARC figures published in April 2026 and Advertising Pays 2025.
Source: Whito, whito.co.uk/research/uk-advertising-spend-statistics, April 2026. Free to quote with a link to this page.
Last Updated on September 28, 2026
UK advertising is about to pass £50 billion a year. Before you feel any pressure to spend more, look at one other number first.
According to Advertising Pays 2025, £1 spent on advertising generates a profit return of £4.11 for medium and large businesses. For micro and small businesses, the same £1 returns £1.89.
Same country. Same channels. Less than half the return.
The gap is not talent and it is not luck. It is structure. Bigger firms have tracking, follow-up, repeat purchase systems and clear offers, so every pound of media works harder. Most small firms respond to numbers like these by copying what the big spenders do. That is the wrong lesson, and this page explains why.
Below are the verified numbers on where the UK’s £46.7 billion went in 2025, who ended up with it, and what it actually returned. Every figure is dated and sourced, and the methodology section explains what the numbers can and cannot tell you.
Key UK advertising statistics
UK advertising investment reached £46.7 billion in 2025, up 6.4% year on year. AA/WARC, April 2026
2026 is forecast at £50.5 billion, up 8.2%, the first year above £50 billion. AA/WARC, July 2026
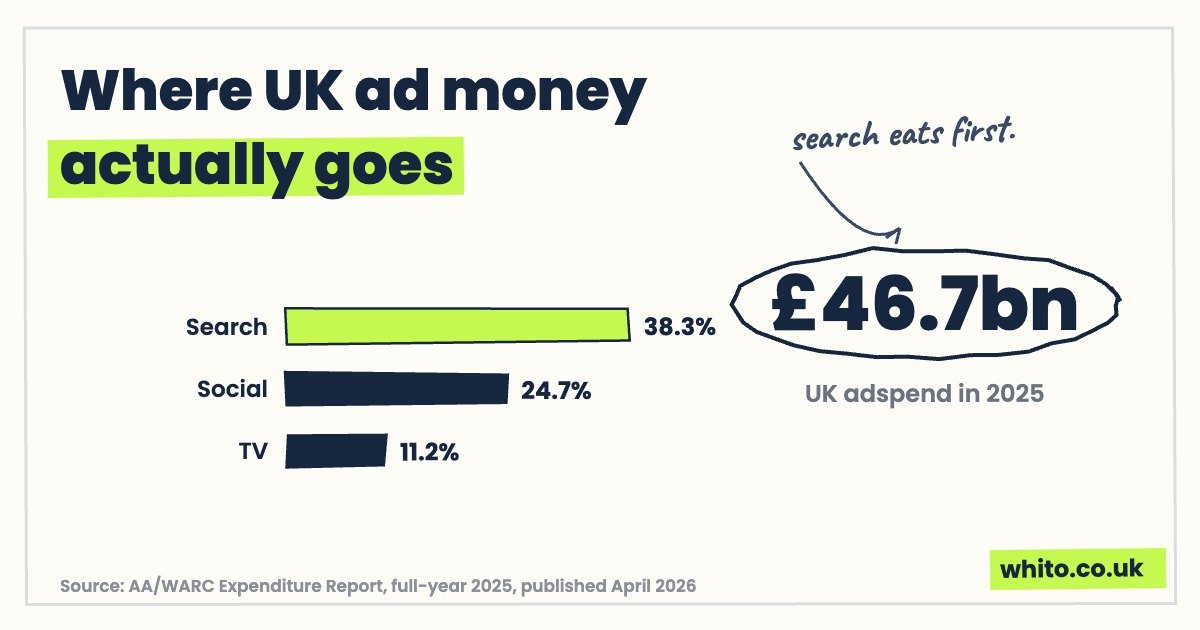
Search took 38.3% of all UK adspend in 2025, social media 24.7% and TV 11.2%. AA/WARC, April 2026
The UK digital ad market passed £40 billion in 2025, up 10% against UK GDP growth of 1.4%. IAB UK / Oliver Wyman, March 2026
Mobile took 71% of UK digital adspend in the first half of 2025, worth £13.3 billion. IAB UK, September 2025
£1 of advertising returns £4.11 in profit for medium and large firms, but £1.89 for micro and small firms. Advertising Pays 2025, May 2025, 2024 data
Advertising supports 1.7 million UK jobs, 5% of all UK employment. Advertising Pays 2025, May 2025, 2024 data
In 2019, Google and Facebook together earned about 80% of the roughly £14 billion UK digital ad market. CMA market study, July 2020, 2019 data
Globally, Alphabet, Meta and Amazon control 57.6% of the advertising market. WPP Media, June 2026, global figure
The ASA resolved over 40,000 complaints in 2025 and had 22,383 ads amended or removed. ASA Annual Report 2025, April 2026
The headline numbers
Total UK adspend reached £46.7 billion in 2025, up 6.4% on the year before (AA/WARC Expenditure Report full-year figures, published 30 April 2026). AA/WARC is the standard measure of UK advertising investment.
One important note before the numbers. AA/WARC refreshed its methodology in April 2026. Search now excludes retail media, and the historical series has been restated. That means its 6.4% growth figure is calculated against a restated base, and you cannot compare the new £46.7 billion figure directly with figures from older editions of the report. We do not do that anywhere on this page, and you should not either.
For context only, the previous edition of the report, published in April 2025 under the old methodology, recorded 2024 adspend of £42.6 billion, up 10.4%, or 7.6% in real terms. That report also found that £4 in every £5 of UK ad budgets was spent online. Treat those as figures from the 2024 report, not as a base for calculating 2025 growth.
The momentum has carried into 2026. Here is the sequence, all on the refreshed AA/WARC methodology.
| Period | UK adspend | Change year on year | Status |
|---|---|---|---|
| Full year 2025 | £46.7 billion | +6.4% | Actual |
| Q4 2025 | £12.9 billion | +8.0% | Actual |
| Q1 2026 | £11.7 billion | +9.3% | Actual |
| Full year 2026 | £50.5 billion | +8.2% | Forecast |
| Full year 2027 | £53.5 billion | +5.9% | Forecast |
Source: AA/WARC Expenditure Report, refreshed methodology. Full-year 2025 and Q4 2025 published 30 April 2026; Q1 2026 and forecasts published 30 July 2026. UK media investment.
If the 2026 forecast holds, this will be the first year UK advertising passes £50 billion. Growth is also accelerating, not slowing: Q1 2026 grew 9.3%, faster than 2025 as a whole.
Search was the engine of that first quarter. It took £4.6 billion in Q1 2026 alone, up 9.8%, making it comfortably the largest single channel. If your customers use Google to find businesses like yours, that is where your competitors’ money is going. Our sister report on UK PPC statistics covers what that costs in practice.
Where the money goes, channel by channel
Two channels now take almost two thirds of every UK advertising pound. Search alone is 38.3% of the market. Add social media at 24.7% and you are at 63% before television, print, radio, outdoor or cinema get a look in.
Share of total UK advertising investment by channel, 2025. Source: AA/WARC Expenditure Report, published 30 April 2026, refreshed methodology. Base: £46.7 billion UK media investment. Remaining share is spread across all other channels.
Share tells you where the money sits. Growth tells you where it is moving. The 2025 growth figures show money flowing towards anything targetable and measurable, and away from anything that is not.
| Channel | 2025 growth | Note |
|---|---|---|
| Addressable TV | +37.0% | Fastest growing channel |
| Social media | +21.0% | 24.7% of the whole market |
| Retail media | +17.5% | Ads within retailers’ own sites and apps |
| Online radio | +14.9% | |
| Search | +5.8% | Largest channel at 38.3% share |
| Cinema | +3.4% | |
| Out-of-home | +2.3% | |
| TV | -1.2% | £5,216.1m in 2025 |
| Online classified | -2.2% | |
| Published media | -5.1% | £1,552.2m in 2025 |
UK advertising spend growth by channel, 2025 versus 2024, restated base. Source: AA/WARC Expenditure Report, published 30 April 2026, refreshed methodology.
Read that table as a small business owner and one thing should stand out. The channels growing fastest, addressable TV, social, retail media, are the ones where advertisers can target specific people and measure specific outcomes. The channels shrinking, print and linear TV, are the ones where they cannot.
The market is voting for accountability. Your budget should too.
The digital detail
The IAB UK, working with Oliver Wyman, measures the digital slice of the market separately. Its full-year 2025 study, published on 3 March 2026, found that UK digital adspend passed £40 billion for the first time, up 10% in a year when UK GDP grew 1.4%.
Digital advertising grew roughly seven times faster than the economy it sits in. Within that £40 billion, the shape of spending looks like this.
UK digital advertising spend by format, 2025. Source: IAB UK Digital Adspend with Oliver Wyman, published 3 March 2026. Base: UK digital ad market of over £40 billion. Categories are not mutually exclusive of the total shown; video overlaps other formats in IAB reporting.
Search took £17.9 billion, which is 44% of digital, up 6%. Social took £11.5 billion, 28% of digital, up 21%. Video reached £9.3 billion, 23% of digital, up 20%. Retail media hit £3.8 billion, up 18%.
Two other IAB findings matter for anyone building a website or a campaign. From its H1 2025 release: mobile took 71% of digital spend, worth £13.3 billion, and programmatic buying now accounts for 78% of digital display. If your landing pages are slow or awkward on a phone, you are fighting the entire direction of the market.
The IAB expects the digital market to reach £44.7 billion in 2026 and £49.1 billion by 2027.
One caution. IAB UK and AA/WARC measure different things using different definitions, so you cannot divide one into the other to get a “digital share” of UK advertising. They are two rulers, not two readings on the same ruler. The Known limits section covers this properly.
Social’s 21% growth is worth a closer look if you sell to consumers. We break down platform-by-platform usage in our UK social media statistics report.
Who the money actually goes to
Follow the £46.7 billion far enough and most of it lands in very few places.
The most thorough public examination of this in the UK remains the Competition and Markets Authority’s market study into online platforms and digital advertising, published in July 2020 and based on 2019 data. Its findings are now several years old and the market has changed since, so treat them as a dated benchmark, not a current reading.
| CMA finding (2019 data) | Market size in 2019 | Concentration in 2019 |
|---|---|---|
| UK search advertising | £7.3 billion | Google held over 90% |
| UK display advertising | £5.5 billion | Facebook held over 50% |
| UK digital advertising overall | Roughly £14 billion | Google and Facebook together earned about 80% |
Source: CMA online platforms and digital advertising market study, published July 2020. All figures are 2019 data and should not be read as current market shares. The CMA noted this equated to about £500 per UK household.
Has concentration eased since 2019? The most recent signal we have is global rather than UK-specific, so label it accordingly. WPP Media’s This Year Next Year midyear forecast, published in June 2026, expects global ad revenue to grow 8.9% to £959 billion ($1.3 trillion) in 2026, and finds that the top three sellers, Alphabet, Meta and Amazon, control 57.6% of the global market. It also notes that global ad revenue is at its highest share of GDP since 1999.
The cast has grown from two to three, with Amazon joining Google and Meta. The concentration has not gone away.
For a small business, this is not a reason for outrage. It is a reason for realism. When you buy search or social advertising, you are buying from a handful of sellers who set the auction rules. You cannot negotiate the price. The only lever you control is how well your own business converts the clicks you pay for. That lever is worth more than any targeting trick.
What advertising returns
Spend is only half the story. The better question is what comes back.
Advertising Pays 2025, produced by Credos for the Advertising Association and published in May 2025 using 2024 data, is the broadest UK study of advertising’s economic return. Its headline findings: advertising supports 1.7 million UK jobs, 5% of all UK employment, and advertising and marketing contributed £109 billion of gross value added in 2024, 4% of UK GVA. UK advertising services exports reached £17.9 billion in 2024, second only to the US.
It also found that 3.5 million UK businesses invested an estimated £66.6 billion in advertising in 2024. That figure is total investment including production costs, so it sits above the media-space figures elsewhere on this page and should not be compared with them.
But the finding that matters most for readers of this page is the return split.
Profit return on £1 of advertising spend by business size. Source: Advertising Pays 2025, Credos for the Advertising Association, published May 2025, based on 2024 data covering UK businesses.
£4.11 back per pound for medium and large firms. £1.89 for micro and small firms. Both are positive, so advertising works at every size. But the gap is the story.
Larger firms do not get better clicks. They get more from each click, because the machinery behind the ad is stronger. They track which enquiries turn into revenue. They follow up every lead, quickly and repeatedly. They have offers designed to convert and systems that bring customers back. Small firms often bolt advertising onto a business with none of that in place, then conclude that advertising does not work.
The same pound returns £4.11 to a business with structure behind it and £1.89 to one without. Advertising does not create structure. It multiplies whatever structure you already have.
The rules
All this spend operates under a regulator, and the regulator has had a busy year. The Advertising Standards Authority’s Annual Report 2025, published in April 2026, sets out the scale.
| ASA activity in 2025 | Figure |
|---|---|
| Complaints resolved | Over 40,000 |
| Ads those complaints concerned | 25,397 |
| Ads amended or removed | 22,383 |
| Ads processed by AI-powered Active Ad Monitoring | 60 million |
Source: ASA Annual Report 2025, published April 2026. UK figures for calendar year 2025.
Two numbers deserve attention. First, 22,383 ads were amended or removed in a single year, and most of them belonged to businesses that did not think of themselves as rule-breakers. Vague claims like “the best in town”, prices that quietly exclude VAT, before-and-after photos you cannot substantiate: this is the ordinary territory of ASA rulings.
Second, the ASA’s Active Ad Monitoring system processed 60 million ads using AI. Enforcement no longer waits for a complaint. If your ads make claims you cannot prove, the odds of being noticed have shortened considerably.
The fix is cheap: claim only what you can evidence, show full prices, and keep proof for anything you say about results. Compliance is a one-hour job. A ruling is a public record with your business name on it.
What this means for a small budget
Here is the mistake this page exists to prevent. A small business owner reads that the market spends 38.3% on search, 24.7% on social and 11.2% on TV, and quietly treats that mix as a recipe.
It is not a recipe. It is the average behaviour of a market dominated by advertisers spending millions, whose problems are nothing like yours. A national brand splits budget across channels to maintain awareness among people who will not buy for months. You need this month’s spend to produce this month’s customers.
Do not copy the channel mix of a business a thousand times your size. Copy the discipline: measure what comes back, and stop paying for what does not.
A more honest translation of the national numbers into small business terms looks like this.
| What the big-market number says | What a small budget should do |
|---|---|
| Search is 38.3% of the market and still growing | Be findable first. Google Business Profile, a fast site, then paid search on the exact terms buyers use, one location, one service at a time |
| Social grew 21% in 2025 | Pick one platform your customers actually use and post consistently, rather than being thin on four |
| Mobile took 71% of digital spend | Test your own site on a phone before spending a pound sending traffic to it |
| Addressable TV grew 37% | Ignore it until search and social are producing measured, profitable leads |
| Small firms average £1.89 back per £1 | Fix conversion and follow-up before increasing spend. The gap to £4.11 is structural, not creative |
Whito interpretation of the sourced figures above for micro and UK businesses. The left column repeats figures from AA/WARC (April 2026), IAB UK (March 2026 and September 2025) and Advertising Pays 2025 (May 2025).
The order matters more than the amounts. Get the foundations right: a clear offer, a page that converts, a way of tracking which enquiries came from where. Then buy traffic. A business that does this in the wrong order funds the £50 billion market and keeps very little of the return.
If you want the underlying data on any of this, all of our sourced UK reports live in the Whito research hub.
Methodology and sources
Every figure on this page comes from one of the primary sources below. Nothing is estimated by Whito, and where a source’s data year differs from its publication date, both are stated.
| Source | Type | Published | Covers |
|---|---|---|---|
| AA/WARC Expenditure Report, full-year 2025 | Industry body | 30 April 2026 | 2025 UK adspend, refreshed methodology |
| AA/WARC Q1 2026 release | Industry body | 30 July 2026 | Q1 2026 actuals, 2026 and 2027 forecasts |
| AA/WARC full-year 2024 report | Industry body | April 2025 | 2024 UK adspend, pre-refresh methodology |
| IAB UK Digital Adspend 2025, with Oliver Wyman | Industry body | 3 March 2026 | 2025 UK digital ad market |
| IAB UK H1 2025 release | Industry body | September 2025 | H1 2025 mobile and programmatic shares |
| CMA online platforms and digital advertising market study | Official (regulator) | July 2020 | 2019 UK digital advertising market data |
| WPP Media, This Year Next Year midyear 2026 | Commercial | June 2026 | Global market forecasts and concentration |
| Advertising Pays 2025, Credos / Advertising Association | Industry body | May 2025 | 2024 data on jobs, GVA and ROI by business size |
| ASA Annual Report 2025 | Regulator | April 2026 | 2025 complaints and enforcement |
All sources checked August 2026. Industry-body figures are produced by organisations that represent advertisers, which is worth bearing in mind when reading their commentary, though their expenditure data is the accepted standard.
Known limits. Three things this page deliberately does not do. First, AA/WARC refreshed its methodology in April 2026: search now excludes retail media and the historical series has been restated, so growth rates are not comparable across editions of the report. We quote the 2024 report’s £42.6 billion as a figure from that report only and never calculate growth between it and the restated £46.7 billion; the only valid 2025 growth figure is AA/WARC’s own 6.4% against its restated base. Second, IAB UK and AA/WARC use different definitions and different measurement approaches, so their figures must not be divided into each other, and we do not present a “digital share” built from the two. Third, the CMA’s concentration findings are 2019 data from a July 2020 study and are presented as historical benchmarks, not current market shares; the WPP Media concentration figure is global, not UK-specific, and is labelled as such.
How to cite this page
Whito, “UK Advertising Spend Statistics 2026”, whito.co.uk, updated 21 August 2026. Reuse of the figures and charts on this page is permitted with attribution and a link to this page.
Frequently asked questions
How much is spent on advertising in the UK?
UK advertising investment reached £46.7 billion in 2025, up 6.4% year on year, according to the AA/WARC Expenditure Report published in April 2026. AA/WARC forecasts £50.5 billion for 2026, which would be the first year above £50 billion.
What is the biggest advertising channel in the UK?
Search. It took 38.3% of all UK adspend in 2025 on AA/WARC’s refreshed methodology, ahead of social media at 24.7% and TV at 11.2%. In Q1 2026 alone, search took £4.6 billion, up 9.8%.
Do Google and Meta still dominate UK advertising?
The last thorough UK measurement is the CMA’s market study, published in July 2020 using 2019 data, which found Google and Facebook together earned about 80% of the roughly £14 billion UK digital ad market that year. More recently and globally, WPP Media reported in June 2026 that Alphabet, Meta and Amazon control 57.6% of the world advertising market, so concentration remains high.
What return does advertising give UK small businesses?
Advertising Pays 2025, using 2024 data, found £1 of advertising generates a profit return of £4.11 for medium and large businesses but £1.89 for micro and businesses. The gap reflects structure, such as tracking, follow-up and conversion systems, rather than channel choice.
How fast is UK digital advertising growing?
The UK digital ad market passed £40 billion in 2025, up 10% against UK GDP growth of 1.4%, according to IAB UK and Oliver Wyman. The IAB forecasts £44.7 billion in 2026 and £49.1 billion by 2027, with mobile already taking 71% of digital spend.
The takeaway
UK advertising will pass £50 billion a year in 2026, and most of it flows through a handful of platforms whose auction prices you cannot influence.
What you can influence is the return. The evidence says structure, not spend, is what separates the firms getting £4.11 per pound from those getting £1.89. Fix your offer, your pages and your follow-up before you increase your budget, and the market’s growth becomes your opportunity rather than your cost.
Structure before scale. The £46.7 billion market will still be there when you are ready to buy from it properly.
The structural checks behind this research run on any website in about twenty seconds. Enter yours and read the full result on the page. Free, and we do not ask for your email.
Run the free Visibility CheckIf your business is named here and you think we have a fact wrong, email hello@whito.co.uk and we will check it and correct it. If you want to respond, send us a statement and we will publish it alongside. Full detail: Corrections, right of reply and removals.