
Last Updated on September 28, 2026
A number has been doing the rounds since the start of the month. Advertisers lost an estimated £18.7 billion ($25.3 billion) to ad fraud in the first half of 2026, and roughly one pound in every eighteen spent on digital advertising went to fraudulent traffic.
It is a good number. Alarming, round, easy to repeat. If you use an agency, there is a fair chance it arrives in your inbox this quarter attached to a proposal.
Before you act on it, look at how it was built.
What the report actually says
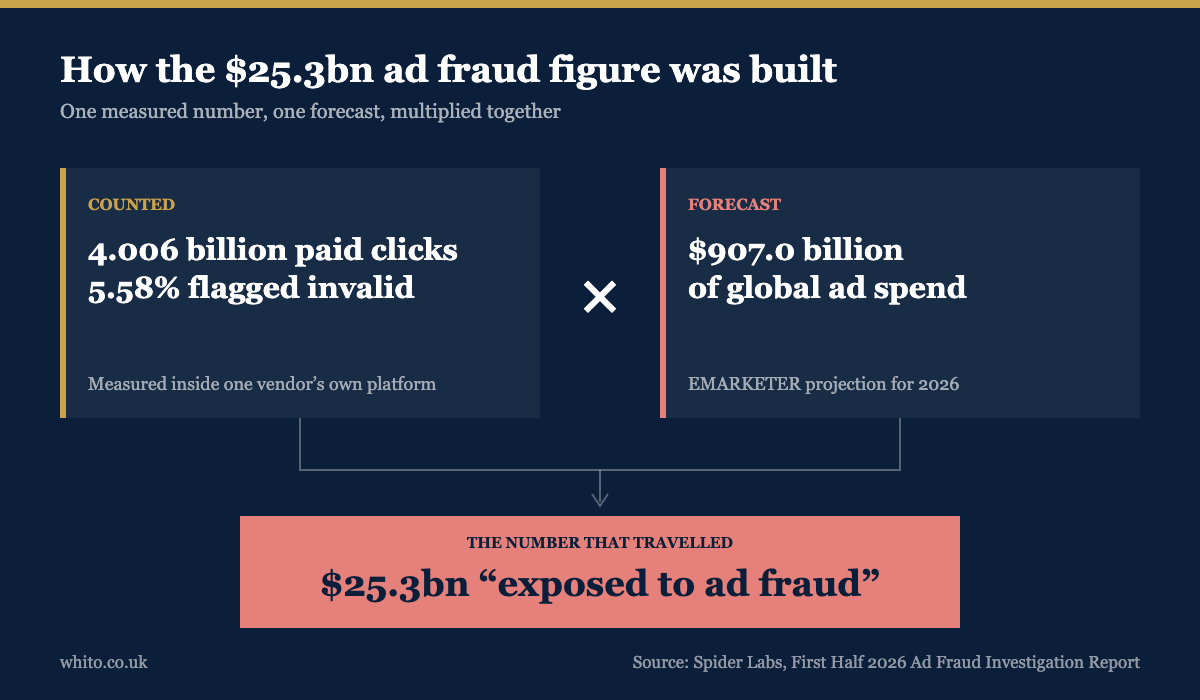
The source is Spider Labs, a Tokyo security firm, and its First Half 2026 Ad Fraud Investigation Report, published on 2 September. The company analysed 4.006 billion paid ad clicks that passed through its own detection platform, Spider AF. Of those, 5.58% were flagged as fraudulent, up from 4.32% across the whole of 2025.
That part is a measurement. Real clicks, counted, with the sample size stated openly.
The £18.7 billion ($25.3 billion) is something else. Spider Labs took that 5.58% rate and applied it to EMARKETER’s projection of £669 billion ($907.0 billion) in worldwide digital ad spending for 2026. A rate, multiplied by a forecast, equals a headline.
Why the difference matters
Two problems, and neither is a complaint about the arithmetic.
The first is the sample. Every one of those 4.006 billion clicks belongs to a business that had already bought ad fraud detection. Firms buy fraud detection because they suspect they have a fraud problem, or because they spend enough that checking is worth the money. That is not a random slice of the advertising market. It is the slice most likely to be affected by the thing being measured.
The second is the forecast. The £669 billion ($907 billion) is a projection of what the world will spend this year, not a record of what it has spent. Multiply a measured rate from a self-selected sample by a forecast covering a much larger population and you get an estimate of exposure. You do not get a loss.
Spider Labs is straight about this in its own wording. The company says £18.7 billion ($25.3 billion) “was exposed to ad fraud”. The word exposed is doing the work, and it is the first word to fall off when a number starts travelling.
| What was counted | What was calculated |
|---|---|
| 4.006 billion paid clicks through one vendor’s platform | £669 billion ($907.0 billion) of global ad spend, forecast by EMARKETER |
| 5.58% of them flagged as invalid | £18.7 billion ($25.3 billion) “exposed” in six months |
| Advanced bot share rising, month by month | £37.3 billion ($50.6 billion) a year, if the pace holds |
| Evidence | Extrapolation |
The direction is still worth knowing
None of this makes the report worthless. The trend inside it is the measured part, and it is the part that should change what you do.
The share of bot traffic showing advanced, human-like behaviour rose from 20.4% in January 2025 to 64.4% in June 2026. These are bots that move a cursor, scroll a page, and vary the gap between clicks. The old tells are going.
Spider Labs also reports that on made-for-advertising sites, the junk pages built purely to carry ads, 71% of fraud losses came through AI-optimised delivery such as Google Performance Max, against roughly 62% in 2025.
Read that one carefully as well. It is a share of losses on a specific type of rubbish website. It is not a share of your Performance Max budget.
UK businesses put £46.7 billion into advertising last year, and our breakdown of where UK advertising spend actually goes shows the same pattern each time. The less control you have over where an ad appears, the more of your budget lands somewhere you would never have picked.
What to do this week
You cannot verify a global figure. You can verify your own account, and it takes about twenty minutes.
The twenty minute check
1. Compare two numbers. Open your ad platform and your website analytics side by side for the same month. Clicks paid for against sessions recorded. A gap of a few percent is normal. A gap of a third is a conversation.
2. Read your placement report. In Google Ads, Performance Max and Display campaigns both list where your ads appeared. Sort by spend. If you do not recognise the sites at the top, exclude them.
3. Check the quality of your last twenty leads. Not the count, the quality. Wrong numbers, gibberish names and addresses that do not exist cost you the same as real ones.
4. Turn off broad placements for two weeks. Search only. If cost per genuine enquiry falls, you have your answer without paying anyone to find it.
None of that needs a vendor, a contract or a dashboard. Before you spend on fraud detection, it helps to know what you are currently paying per click and whether that is normal for your trade, which is why we publish our study of UK Google Ads and PPC costs.
The takeaway
We hold ourselves to this. When we wanted to know whether AI citations were worth chasing, we did not model it. We counted, and 17,400 citations produced 167 clicks. A smaller number, and a true one.
Treat any figure that arrives already rounded as a prompt to ask one question: was this counted, or was it calculated? Both can be useful. Only one of them describes your business.
Your own account is the only sample that matters. Go and measure it.