
Finding
Only 49% of UK adult social media users actively post, share or comment, down from 61% in 2024, according to Ofcom's tracker of 7,533 UK adults published in April 2026, while Facebook and Messenger still reach 93% of UK online adults each month.
Source: Whito, whito.co.uk/research/uk-social-media-statistics, April 2026. Free to quote with a link to this page.
Last Updated on September 17, 2026
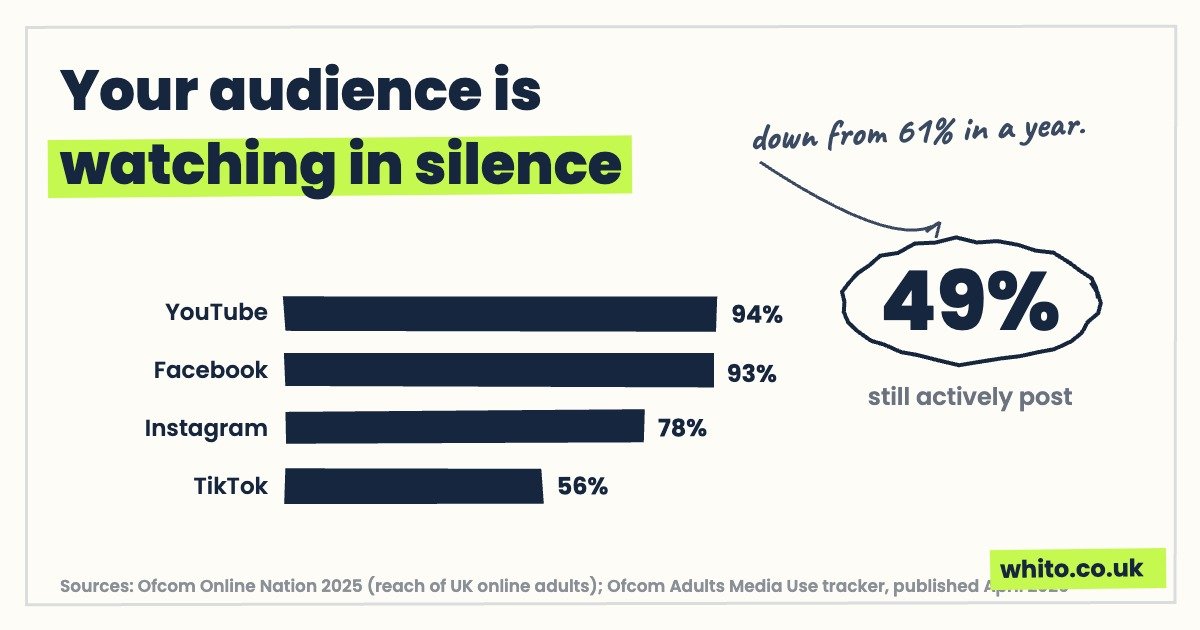
Here is a number that should change how you think about social media: only 49% of UK adult social media users now actively post, share or comment. Two years ago it was 61%.
Most of your audience has gone quiet. They are still there, still scrolling, still watching your posts. They just do not like, comment or share any more.
That matters, because most small businesses still judge social media by likes and follower counts. If half the audience never touches the like button, those numbers are measuring an ever smaller slice of the people actually seeing your work.
This page pulls together the verified UK social media statistics for 2026: who you can reach, where they are, what businesses spend, and what small firms actually get back. Every figure is sourced and dated, with the survey base stated, so you can tell the solid numbers from the marketing fluff.
Key UK social media statistics
- 89% of UK adult internet users use social media, rising to 97% of 16 to 34 year olds (Ofcom, April 2026)
- Only 49% of adult social media users actively post, share or comment, down from 61% in 2024 (Ofcom, April 2026)
- YouTube reaches 94% of UK online adults each month; Facebook and Messenger combined reach 93% (Ofcom Online Nation, December 2025)
- Instagram’s monthly reach is 78%, up 7% year on year; Reddit is up 28% to 60% (Ofcom Online Nation, December 2025)
- X’s monthly reach fell from 45% to 39% of UK online adults (Ofcom Online Nation, December 2025)
- UK social media adspend hit £11.5bn in 2025, up 21%, and is now 28% of the digital ad market (IAB UK, March 2026)
- 84% of small business owners who market on social media generate some business through it; 60% can point to work won from a single post (Markel Direct, July 2026)
- There are 55.5 million active social media user identities in UK ad tools, equal to 79.7% of the population, though identities are not the same as unique people (DataReportal, October 2025 data)
- Facebook is Britons’ most named primary social shopping platform at 11%, ahead of TikTok at 7% (YouGov, March 2025)
- More than 300,000 UK small businesses were selling on TikTok Shop by July 2026 (TikTok figures reported by Retail Gazette)
How many people you can actually reach
89% of UK adult internet users use social media, per Ofcom’s 2026 media use tracker of 7,533 UK adults. That is the ceiling. Among 16 to 34 year olds it is 97%, which is close to everyone.
So the audience is there. Whatever you sell, the people who buy it are on at least one social platform. The question is never whether your customers use social media. It is which platform, and whether you can reach them affordably.
The advertising view gives a second angle. DataReportal’s Digital 2026 UK report, using platform ad-tool data from October 2025, counts 55.5 million active social media user identities in the UK, equal to 79.7% of the population.
One honest caveat before you quote that figure anywhere. Ad-tool numbers count user identities, not verified people. One person with a personal account, a business account and an old account they forgot about can show up three times. Treat these as ad reach, not headcount.
| Platform | UK ad reach (identities) | Note |
|---|---|---|
| YouTube | 55.5m | Ad-tool identities |
| 48.0m | Registered members, not active users | |
| 38.8m | Ad-tool identities | |
| 35.5m | Ad-tool identities | |
| TikTok | 26.8m | Aged 18 and over; ad audience is 61.5% female |
| X | 19.0m | Ad-tool identities |
Source: DataReportal Digital 2026 United Kingdom (Kepios/We Are Social), data from October 2025. Base: platform advertising tools. Figures are user identities and may not represent unique people.
Two different rulers, then. Ofcom measures the share of UK online adults who visit a platform. DataReportal measures how many accounts a platform’s ad tools will let you target. Both are useful. Never mix them in the same sentence, because they measure different things.
Where UK adults actually are, platform by platform
Ofcom’s Online Nation 2025 report, built on the Ipsos iris panel of UK online adults in May 2025, is the cleanest picture of monthly reach. It measures who actually visits, not who has an account gathering dust.
Monthly reach among UK online adults. Source: Ofcom Online Nation 2025 (Ipsos iris panel, May 2025 data, published December 2025). Percentages are of UK online adults, not the whole population.
A few things jump out of that chart.
Facebook is not dead. Combined with Messenger it reaches 93% of UK online adults every month. If you have quietly written it off because your nephew says nobody uses it, the data disagrees.
Instagram is still growing, up 7% year on year to 78% reach. Reddit is the quiet mover, up 28% to reach 60% of online adults, helped by how often it now appears in Google results. TikTok grew 14% to 56%.
X is the only major platform in decline, down from 45% to 39%. If your marketing plan still treats it as essential, it is worth asking what it has won you lately.
Reach tells you who visits. Time tells you who pays attention.
| Measure | Time | Direction |
|---|---|---|
| Average UK adult, total time online per day | 4 hours 30 minutes | Across all services |
| YouTube users, time on YouTube per day | 51 minutes | Up from 47 minutes |
| Facebook and Messenger users, time per day | 43 minutes | Second only to YouTube |
Source: Ofcom Online Nation 2025 (Ipsos iris panel, May 2025 data, published December 2025). Base: UK online adults; per-platform figures are among that platform’s users.
The practical read: YouTube and Facebook still take the biggest share of UK attention by a distance. Newer platforms get the headlines. Older platforms get the hours.
The lurker shift: half your audience has gone silent
Only half of UK social media users ever like, comment or share. The number this article opened with deserves a proper look.
Ofcom’s 2026 tracker found that only 49% of UK adult social media users actively post, share or comment. In 2024 that figure was 61%. That is a 12 point drop in two years.
Share of UK adult social media users who actively post, share or comment. Source: Ofcom Adults’ Media Use and Attitudes tracker (7,533 UK adults aged 16+, fieldwork September to November 2025, published April 2026).
Social media is turning into television with a comments section most people ignore. The majority now watch, read and judge in silence, then act offline: they ring you, visit you, or search your name on Google.
Only 49% of UK adult social media users now actively post, share or comment, down from 61% in 2024. Most of your audience is watching in silence.
Source: Ofcom Adults’ Media Use and Attitudes tracker, published April 2026. Base: UK adult social media users.
This is why judging your social media by likes is a mistake. A post seen by 800 locals that gets three likes has not failed. The three likes came from the shrinking minority who still interact at all. The other 797 saw your name, your work and your prices, and said nothing.
One more honesty note while we are here. There is no verified UK-wide engagement-rate benchmark. Any article telling you that a “good” engagement rate is 2% or 5% is quoting a vendor’s sample, not a national statistic. Ignore the benchmark chase and measure enquiries instead.
Money follows attention, and the money is now serious. The IAB UK Digital Adspend study, run with Oliver Wyman and published in March 2026, put UK social media advertising at £11.5bn for 2025. That is up 21% in a single year.
Social now takes 28% of the entire UK digital advertising market. More than one pound in every four spent on digital ads in this country goes to a social platform.
Social media’s share of UK digital advertising spend, full-year 2025. Source: IAB UK Digital Adspend study with Oliver Wyman, published March 2026. Base: UK digital advertising market.
What does that mean for a small business? Two things.
First, organic reach keeps getting squeezed. When platforms make £11.5bn a year selling visibility, they have little reason to hand it out free. The years of easy organic Facebook reach are not coming back.
Second, 21% growth means auction prices rise. Every year you wait, the same click costs more. That is not a reason to panic-spend. It is a reason to fix your offer and your landing pages first, so that when you do pay for clicks, they convert. We cover the wider spending picture in our UK advertising spend statistics report.
National spend figures are one thing. What does a plumber, a groomer or a builder actually get back?
A Censuswide survey for Markel Direct, published in July 2026, asked 501 UK tradespeople and small business owners. One important thing about the base before you read the numbers: everyone surveyed already uses social media to market their business. These percentages describe users, not all tradespeople. The firms that tried social and quit are not in the sample.
With that said, the results from active users are strong.
Source: Censuswide survey for Markel Direct, published July 2026. Base: 501 UK tradespeople and small business owners who already use social media to market their business.
The standout is that 60% can point to specific work won from a single post. Not vague brand awareness. A post, then a job, then an invoice.
60% of UK small business owners who market on social media can point to specific work won from a single post, and 68% say it now matters more than word of mouth.
Source: Censuswide for Markel Direct, July 2026. Base: 501 UK tradespeople and small business owners who use social media for marketing.
Where do they do it, and how much does it cost them in time?
| Finding | Figure |
|---|---|
| Use Facebook for the business | 73% |
| Use Instagram for the business | 63% |
| Owners aged 18 to 24 using Instagram | 77% |
| Owners aged 18 to 24 using TikTok | 73% |
| Manage their own social media | 77% |
| Spend one to three hours a week on content | 54% |
Source: Censuswide survey for Markel Direct, published July 2026. Base: 501 UK tradespeople and small business owners who use social media to market their business.
Note the time figure. For most of these owners, this is one to three hours a week, run by themselves, not an agency retainer. The businesses winning work from social are mostly posting real jobs, real prices and real vans, not polished campaigns.
Note the age split too. Younger owners have already shifted towards Instagram and TikTok. The platform mix that works today will not be the mix in five years.
You can sell products directly through social feeds in the UK, but keep the size of it in proportion.
A YouGov survey of 1,000 UK adults in March 2025 asked Britons to name their primary social shopping platform. Facebook led at 11%, TikTok took 7% and Instagram 5%. So direct social shopping is still a minority habit, not the norm.
| Social shopping in the UK | Figure |
|---|---|
| Name Facebook as their primary social shopping platform | 11% |
| Name TikTok as their primary social shopping platform | 7% |
| Name Instagram as their primary social shopping platform | 5% |
| Buy clothing through social platforms (top category) | 47% |
| Buy beauty products through social platforms | 37% |
| Say discounts drive their social purchases | 49% |
Source: YouGov survey of 1,000 UK adults, March 2025. Category and discount figures are among social shoppers.
The growth story sits with TikTok Shop, though the numbers here come from TikTok itself, so label them accordingly. The platform reported that Black Friday 2025 sales on TikTok Shop UK were up 45% year on year, with 6,000 UK live shopping sessions running daily and more than 200,000 UK small businesses on TikTok Shop by December 2025.
By July 2026, TikTok figures reported by Retail Gazette put that at more than 300,000 UK small businesses selling on TikTok Shop, with live-session sales up 55%. Those are platform-reported numbers, published to promote the platform, so treat them as directional rather than audited. But the direction is clearly up, and the audience skews the way a product seller might want: TikTok’s UK ad audience is 61.5% female.
If you sell physical products, especially clothing or beauty where 47% and 37% of social shoppers buy, social commerce belongs on your test list. If you sell services, it mostly does not. For the wider online retail picture, see our UK ecommerce statistics report.
What this means for your marketing
Put the numbers together and a clear picture forms.
Nearly nine in ten online adults are on social media, but only half of them will ever signal that they saw you. Businesses are pouring in money, up 21% in a year. And the small firms getting results are spending one to three hours a week posting real work, mostly on Facebook and Instagram.
So the sensible response is not to post more, or to chase followers. It is to change what you measure and where you spend effort.
| Stop measuring | Start measuring | Why |
|---|---|---|
| Likes and comments | Reach and profile visits | Only 49% of users interact at all, so likes undercount your real audience |
| Follower growth | Enquiries mentioning social | Followers do not pay invoices; ask every new customer how they found you |
| Posting frequency | Work won from posts | 60% of small business users can trace jobs to a single post, so track yours |
| Being on every platform | One or two platforms done properly | Facebook and Messenger reach 93% of online adults; depth beats spread |
Whito summary of the evidence above. Sources: Ofcom (April 2026 and December 2025), Markel Direct/Censuswide (July 2026), bases as stated in each section.
A simple monthly audit beats a complicated dashboard. Once a month, note three things: how many people your posts reached, how many enquiries mentioned seeing you online, and how much of that turned into paid work. If the last number is zero for three months running, change what you post before you change how often.
And keep the order of operations right. Social media amplifies what you already are. If your offer is muddled or your Google profile is empty, fix that first. Structure before scale. More of our sourced UK research lives in the Whito research hub.
Methodology and sources
Every figure on this page comes from one of the sources below. We state the publisher, the type of source, the date and the base for each. Where a figure is platform-reported, we say so.
- Ofcom Adults’ Media Use and Attitudes tracker (official regulator, published April 2026). 7,533 UK adults aged 16+, fieldwork September to November 2025. Source of the 89%, 97%, 49% and 61% figures.
- Ofcom Online Nation 2025 (official regulator, published December 2025). Ipsos iris panel of UK online adults, May 2025 data. Source of all monthly reach and time-spent figures.
- DataReportal Digital 2026 United Kingdom (commercial, Kepios/We Are Social, published from October 2025 data). Source of ad-reach identity figures and the 55.5 million and 79.7% totals.
- IAB UK Digital Adspend study with Oliver Wyman (industry body, full-year 2025, published March 2026). Source of the £11.5bn, 21% and 28% figures.
- Censuswide survey for Markel Direct (commercial, published July 2026). 501 UK tradespeople and small business owners who use social media to market their business. Source of all small business results figures.
- YouGov social shopping survey (commercial, March 2025). 1,000 UK adults. Source of the social shopping platform and category figures.
- TikTok Newsroom (platform-reported, December 2025). Source of the Black Friday 2025, live session and 200,000 seller figures.
- Retail Gazette reporting TikTok figures (trade press reporting platform figures, July 2026). Source of the 300,000 sellers and 55% live-sales figures.
Known limits. The two main measurement systems on this page use different bases and must not be mixed. Ofcom percentages are shares of UK online adults, measured by panel. DataReportal figures come from platform advertising tools and count user identities, which may not be unique people; one person can hold several accounts, so we label those figures as ad reach throughout. The Markel Direct survey covers only businesses that already use social media for marketing, so its percentages describe users, not all UK tradespeople. TikTok Shop figures are the platform’s own announcements and have not been independently audited. There is no verified UK-wide engagement-rate benchmark, so this page does not quote one.
How to cite this page
Whito, “UK Social Media Marketing Statistics 2026”, whito.co.uk, updated 21 August 2026. Reuse of the figures and charts is permitted with attribution and a link to this page. Please also credit the original source named under each chart.
Frequently asked questions
How many people in the UK use social media?
Ofcom’s 2026 tracker found 89% of UK adult internet users use social media, rising to 97% of 16 to 34 year olds. DataReportal counts 55.5 million active social media user identities, equal to 79.7% of the population, but these are ad-tool identities rather than verified unique people.
Which social media platform reaches the most people in the UK?
YouTube, which reaches 94% of UK online adults each month according to Ofcom’s Online Nation 2025 report. Facebook and Messenger combined reach 93% and WhatsApp reaches 90%, so the older platforms still lead on reach.
How much do UK businesses spend on social media advertising?
UK social media adspend reached £11.5 billion in 2025, up 21% year on year, according to the IAB UK Digital Adspend study with Oliver Wyman. Social media now takes 28% of the UK digital advertising market.
Does social media actually win work for small businesses?
Among UK tradespeople and small business owners who already use social media for marketing, 84% say it generates some business and 60% can point to specific work won from a single post, according to a Censuswide survey for Markel Direct. Those figures describe existing users, not all small businesses.
What is a good social media engagement rate for a UK business?
There is no verified UK-wide engagement-rate benchmark. With only 49% of UK social media users now actively posting, sharing or commenting, engagement understates your real audience, so judge social media on reach, enquiries and won work instead.
The takeaway
UK social media in 2026 is a quiet crowd with money to spend. Nearly nine in ten online adults are there, but only half will ever like, comment or share, so the silence around your posts tells you almost nothing about who is watching.
The businesses getting paid from it are not the ones with the biggest follower counts. They post real work, on one or two platforms where their customers actually are, for a few hours a week, and they track enquiries and jobs rather than likes.
Follower counts are applause. Enquiries are revenue. Measure the second one.
The structural checks behind this research run on any website in about twenty seconds. Enter yours and read the full result on the page. Free, and we do not ask for your email.
Run the free Visibility CheckIf your business is named here and you think we have a fact wrong, email hello@whito.co.uk and we will check it and correct it. If you want to respond, send us a statement and we will publish it alongside. Full detail: Corrections, right of reply and removals.