
Data last verified: 16 November 2026. Figures re-checked against their primary sources under the Whito rolling re-verification programme.
Last Updated on November 16, 2026
Read a short summary
General summary
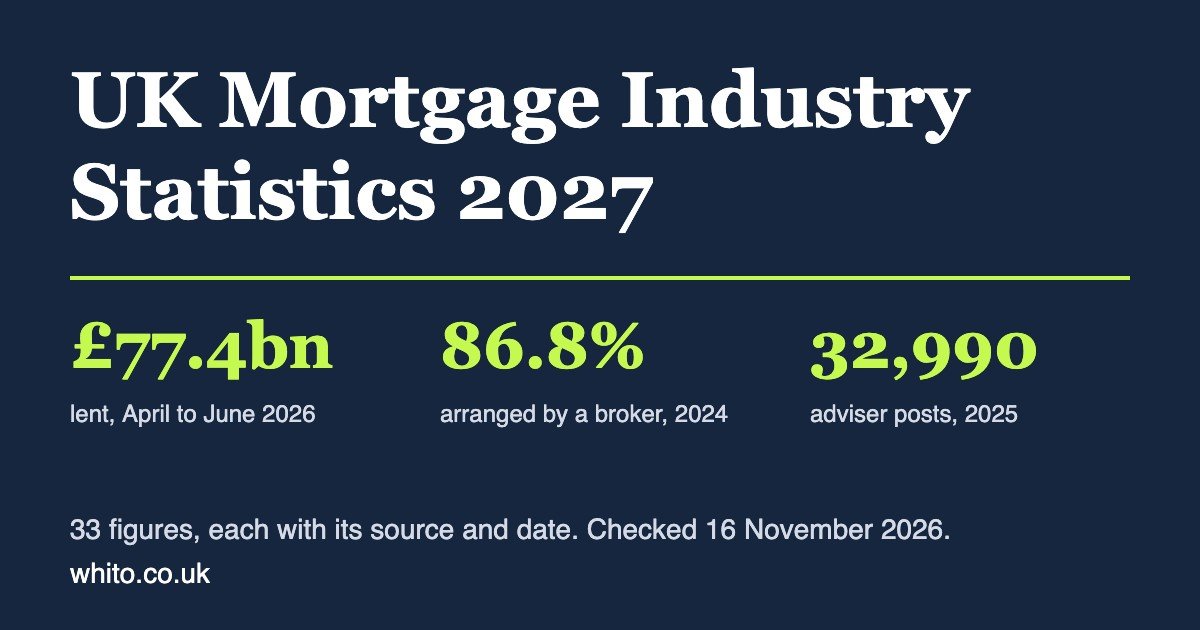
This page brings together 33 dated figures on the UK mortgage market, each from an official or trade source. UK lenders paid out £77.4bn in April to June 2026. Brokers arranged 86.8% of regulated mortgage lending in 2024. Firms reported 32,990 mortgage adviser posts and £1.6bn of mortgage broking revenue for 2025. House purchase approvals fell to 53,400 in September 2026, and 76,080 homeowner mortgages were in arrears in July to September 2026.
Bullet points
- £77.4bn of new mortgage lending in April to June 2026, up 31.7% on a year earlier.
- 86.8% of regulated mortgage lending went through a broker in 2024.
- 32,990 mortgage adviser posts in 2025, and £1.6bn of mortgage broking revenue.
- 53,400 house purchase approvals in September 2026, down from 54,800 in August.
- The average rate on new mortgages was 4.63% in September 2026.
- 76,080 homeowner mortgages were in arrears in July to September 2026, or 0.87% of the total.
- Whito prints no count of mortgage firms yet, and says why.
Basic explainer
A mortgage is a loan to buy a home. Most people in the UK get one through a mortgage broker, a firm that finds and arranges the loan for them. This page lists the main numbers about that market: how much is lent, how many loans are approved, what interest rate people pay, how many advisers there are, and how many people have fallen behind on payments. Every number comes from an official body such as the Bank of England or the Financial Conduct Authority, and each one shows the date it was published.
These summaries were written with AI from this page only. The full page below is the record.
UK lenders paid out £77.4bn of new mortgage lending in April to June 2026. Brokers arranged 86.8% of regulated mortgage lending in 2024, and firms reported 32,990 mortgage adviser posts for 2025. This page lists 33 figures on the UK mortgage market, each with its source and date. Checked by Whito on 16 November 2026.
Whito is a publisher, not an adviser. We are not authorised or regulated by the Financial Conduct Authority. Nothing on this page is financial advice, mortgage advice or a financial promotion.
£77.4bn
lent in April to June 2026
86.8%
of regulated lending arranged through a broker, 2024
32,990
mortgage adviser posts, 2025
53,400
house purchase approvals, September 2026
4.63%
average rate on new mortgages, September 2026
76,080
homeowner mortgages in arrears, July to September 2026
Whito did not collect these figures. We read each one on the page of the body that publishes it, and we print the date. Where two sources measure the same thing in different ways, we show both. Where a figure is an estimate or a forecast, we say so. The UK Mortgage Industry Intelligence Hub carries the short version, with rankings, research and a directory.
Size of the market
How much is lent, and how much is owed.
£242.0bn
Total new mortgage lending in a year
2024. IMLA estimates £288bn for 2025 and forecasts £320bn for 2026 and £350bn for 2027. A forecast is not a fact.
Source: IMLA, The new ‘normal’: prospects for 2026 and 2027 (Table 2). Published December 2025.
£77.4bn
New mortgage lending paid out in a quarter
April to June 2026. Up 11.1% on the quarter before and 31.7% on a year earlier.
Source: FCA and Bank of England, Mortgage lending statistics, Q2 2026. Published 8 September 2026.
£79.2bn
New mortgage lending agreed for the months ahead
April to June 2026. Lenders call these new commitments. Up 1.4% on the quarter before.
Source: FCA and Bank of England, Mortgage lending statistics, Q2 2026. Published 8 September 2026.
£1,760.6bn
Home mortgage debt outstanding
End of June 2026. Up 0.8% on the quarter before and 3.1% on a year earlier.
Source: FCA and Bank of England, Mortgage lending statistics, Q2 2026. Published 8 September 2026.
£24.2bn
New mortgage lending in a month
September 2026. Repayments were £21.4bn. Net new borrowing was £3.9bn, down from £4.2bn in August.
Source: Bank of England, Money and Credit, September 2026. Published 29 October 2026.
Approvals and sales
Approvals show what lenders have agreed to lend in the months ahead. Completed sales show what has already happened.
53,400
Mortgages approved for house purchase
September 2026. Down from 54,800 in August. The average of the six months before was about 58,800.
Source: Bank of England, Money and Credit, September 2026. Published 29 October 2026.
42,600
Approvals to remortgage with a new lender
September 2026. Up from 34,000 in August. Switching deals with the same lender is not counted.
Source: Bank of England, Money and Credit, September 2026. Published 29 October 2026.
94,800
Home sales completed in the UK
September 2026. Seasonally adjusted and provisional. 4% lower than September 2025. Counts sales of £40,000 or more.
Source: HMRC, UK monthly property transactions. Published 30 October 2026.
Interest rates
What borrowers are paying, on new loans and on all loans.
4.63%
Average rate on newly drawn mortgages
September 2026. Up from 4.60% in August.
Source: Bank of England, Money and Credit, September 2026. Published 29 October 2026.
4.03%
Average rate across all existing mortgages
September 2026. Up from 4.00% in August.
Source: Bank of England, Money and Credit, September 2026. Published 29 October 2026.
What the lending is for
Each figure is a share of all new lending paid out in the quarter. The first four do not add up to 100% because other kinds of lending make up the rest. The last row is a different cut: loans above 90% of the value of the home.
31.2%
Remortgages, share of new lending
April to June 2026. Up 3.1 points on the quarter before.
Source: FCA and Bank of England, Mortgage lending statistics, Q2 2026. Published 8 September 2026.
28.8%
Home movers, share of new lending
April to June 2026. Down 1.5 points on the quarter before.
Source: FCA and Bank of England, Mortgage lending statistics, Q2 2026. Published 8 September 2026.
27.3%
First-time buyers, share of new lending
April to June 2026. Down 0.1 points on the quarter before.
Source: FCA and Bank of England, Mortgage lending statistics, Q2 2026. Published 8 September 2026.
8.0%
Buy-to-let, share of new lending
April to June 2026. Down 1.2 points on a year earlier.
Source: FCA and Bank of England, Mortgage lending statistics, Q2 2026. Published 8 September 2026.
8.4%
Loans above 90% of the home’s value, share of new lending
April to June 2026. The highest share since spring 2008.
Source: FCA and Bank of England, Mortgage lending statistics, Q2 2026. Published 8 September 2026.
Brokers and advisers
The advice sector: how much lending goes through it, how many adviser posts there are, and what firms earn.
86.8%
Share of regulated mortgage lending arranged through a broker
2024. Regulated loans only. 86.5% estimated for 2025 and 86.9% forecast for 2026.
Source: IMLA, The new ‘normal’: prospects for 2026 and 2027 (Table 2). Published December 2025.
£178.3bn
Regulated mortgage lending arranged through brokers
2024. £204.5bn estimated for 2025.
Source: IMLA, The new ‘normal’: prospects for 2026 and 2027 (Table 2). Published December 2025.
32,990
Mortgage adviser posts reported by firms
2025. Down from 34,342 in 2024. The FCA changed how it groups firms in 2025, so read the change with care.
Source: FCA, Retail intermediary market data 2025. Published 23 July 2026.
£1.6bn
Revenue firms reported from mortgage broking
2025. Up 15.9% on 2024.
Source: FCA, Retail intermediary market data 2025. Published 23 July 2026.
77.5%
Share of mortgage broking revenue that is commission
2025. No change from 2024.
Source: FCA, Retail intermediary market data 2025. Published 23 July 2026.
The FCA’s two figures for 2025 work out at about £48,500 of reported mortgage broking revenue for each mortgage adviser post.
Whito’s sum: £1.6bn divided by 32,990 posts, rounded to the nearest £100. The £1.6bn is itself rounded by the FCA, so treat the answer as a guide. It is revenue to the firm for each post, not what an adviser earns. Free to quote with a link to this page.
Borrowers
From the FCA’s Financial Lives survey of 17,950 UK adults.
14.8 million
UK adults with a home mortgage
May 2024. 27% of UK adults, in their own name or jointly.
Source: FCA, Financial Lives 2024 survey: Mortgages. Published June 2025.
7.7 million
Mortgage holders who took out, moved or switched a mortgage
Three years to May 2024.
Source: FCA, Financial Lives 2024 survey: Mortgages. Published June 2025.
57%
Of those, the share who took advice from a broker
Three years to May 2024. Up from 50% in 2022.
Source: FCA, Financial Lives 2024 survey: Mortgages. Published June 2025.
Staying with the same lender
Most product transfers happen without a broker, which is why brokers watch this number.
£217.4bn
Product transfers in a year
2024. A product transfer is a new deal with the same lender. IMLA estimates £250bn for 2025.
Source: IMLA, The new ‘normal’: prospects for 2026 and 2027 (Table 2). Published December 2025.
Buy-to-let
Lending to landlords.
£34.0bn
Buy-to-let lending in a year
2024. 14.0% of all lending that year. £39bn estimated for 2025 and £44bn forecast for 2026.
Source: IMLA, The new ‘normal’: prospects for 2026 and 2027 (Table 2). Published December 2025.
Later-life lending
UK Finance counts borrowers over 55.
37,300
New loans to borrowers over 55
April to June 2026. Up 13.4% on a year earlier and worth £6.2bn.
Source: UK Finance, Later life lending, Q2 2026. Published 26 August 2026.
5,730
New lifetime mortgages
April to June 2026. Down 1.7% on a year earlier. Worth £490m.
Source: UK Finance, Later life lending, Q2 2026. Published 26 August 2026.
323
New retirement interest-only mortgages
April to June 2026. Up 5.9% on a year earlier. Worth £31m.
Source: UK Finance, Later life lending, Q2 2026. Published 26 August 2026.
Arrears and repossessions
Two sources measure arrears in two ways. We print both and say which is which.
76,080
Homeowner mortgages in arrears
July to September 2026. 0.87% of all homeowner mortgages. 2% fewer than the quarter before. Counts arrears of 2.5% or more of the balance.
Source: UK Finance, Arrears and possessions, Q3 2026. Published 12 November 2026.
8,170
Buy-to-let mortgages in arrears
July to September 2026. 0.43% of all buy-to-let mortgages. 3% fewer than the quarter before.
Source: UK Finance, Arrears and possessions, Q3 2026. Published 12 November 2026.
1,150
Homeowner properties repossessed
July to September 2026. Unchanged on the quarter before.
Source: UK Finance, Arrears and possessions, Q3 2026. Published 12 November 2026.
690
Buy-to-let properties repossessed
July to September 2026. 10% more than the quarter before.
Source: UK Finance, Arrears and possessions, Q3 2026. Published 12 November 2026.
£19.7bn
Mortgage balances with any arrears
End of June 2026. 1.1% of all balances. This FCA measure is wider than the UK Finance count above, so the two do not match.
Source: FCA and Bank of England, Mortgage lending statistics, Q2 2026. Published 8 September 2026.
Whito’s own research on mortgage advisers
These figures are Whito’s, from our own studies.
50 of 88
Mortgage firms named by AI assistants that were appointed representatives
8 September 2026. Two AI assistants were asked for the best mortgage adviser in 12 UK cities. An appointed representative trades under another firm’s FCA authorisation. 17 of the 88 had no matching local FCA permission.
Source: Whito, We Asked AI for a Mortgage Adviser. Then We Checked the FCA Register.
5 of 71
Mortgage firms recommended by all three AI assistants
August 2026. Three AI assistants, six UK cities, 71 firms named.
Source: Whito, We Asked 3 AI Engines to Name the Best Mortgage Adviser in 6 UK Cities
5.4 out of 10
Average marketing score of ten UK mortgage broker brands
22 October 2026. Seven channels scored by hand against fixed rules. Email was the weakest channel at 3.0.
Source: Whito, UK Mortgage Broker Marketing Leaderboard 2026
What this page does not have yet
- The number of mortgage advice firms. The FCA publishes a spreadsheet with its 2025 data. Its summary page gives no single count of mortgage firms, and the FCA changed how it groups firms that year. We will print a number once we have read the tables and can say exactly what they count.
- A regional split of firms. We found no public source for it.
- House prices. Left out on purpose. This page is about lending and advice.
All 33 figures in one table
| Measure | Figure | Period | Source | Published |
|---|---|---|---|---|
| Total new mortgage lending in a year | £242.0bn | 2024 | IMLA, The new ‘normal’: prospects for 2026 and 2027 (Table 2) | December 2025 |
| New mortgage lending paid out in a quarter | £77.4bn | April to June 2026 | FCA and Bank of England, Mortgage lending statistics, Q2 2026 | 8 September 2026 |
| New mortgage lending agreed for the months ahead | £79.2bn | April to June 2026 | FCA and Bank of England, Mortgage lending statistics, Q2 2026 | 8 September 2026 |
| Home mortgage debt outstanding | £1,760.6bn | End of June 2026 | FCA and Bank of England, Mortgage lending statistics, Q2 2026 | 8 September 2026 |
| New mortgage lending in a month | £24.2bn | September 2026 | Bank of England, Money and Credit, September 2026 | 29 October 2026 |
| Mortgages approved for house purchase | 53,400 | September 2026 | Bank of England, Money and Credit, September 2026 | 29 October 2026 |
| Approvals to remortgage with a new lender | 42,600 | September 2026 | Bank of England, Money and Credit, September 2026 | 29 October 2026 |
| Home sales completed in the UK | 94,800 | September 2026 | HMRC, UK monthly property transactions | 30 October 2026 |
| Average rate on newly drawn mortgages | 4.63% | September 2026 | Bank of England, Money and Credit, September 2026 | 29 October 2026 |
| Average rate across all existing mortgages | 4.03% | September 2026 | Bank of England, Money and Credit, September 2026 | 29 October 2026 |
| Remortgages, share of new lending | 31.2% | April to June 2026 | FCA and Bank of England, Mortgage lending statistics, Q2 2026 | 8 September 2026 |
| Home movers, share of new lending | 28.8% | April to June 2026 | FCA and Bank of England, Mortgage lending statistics, Q2 2026 | 8 September 2026 |
| First-time buyers, share of new lending | 27.3% | April to June 2026 | FCA and Bank of England, Mortgage lending statistics, Q2 2026 | 8 September 2026 |
| Buy-to-let, share of new lending | 8.0% | April to June 2026 | FCA and Bank of England, Mortgage lending statistics, Q2 2026 | 8 September 2026 |
| Loans above 90% of the home’s value, share of new lending | 8.4% | April to June 2026 | FCA and Bank of England, Mortgage lending statistics, Q2 2026 | 8 September 2026 |
| Share of regulated mortgage lending arranged through a broker | 86.8% | 2024 | IMLA, The new ‘normal’: prospects for 2026 and 2027 (Table 2) | December 2025 |
| Regulated mortgage lending arranged through brokers | £178.3bn | 2024 | IMLA, The new ‘normal’: prospects for 2026 and 2027 (Table 2) | December 2025 |
| Mortgage adviser posts reported by firms | 32,990 | 2025 | FCA, Retail intermediary market data 2025 | 23 July 2026 |
| Revenue firms reported from mortgage broking | £1.6bn | 2025 | FCA, Retail intermediary market data 2025 | 23 July 2026 |
| Share of mortgage broking revenue that is commission | 77.5% | 2025 | FCA, Retail intermediary market data 2025 | 23 July 2026 |
| UK adults with a home mortgage | 14.8 million | May 2024 | FCA, Financial Lives 2024 survey: Mortgages | June 2025 |
| Mortgage holders who took out, moved or switched a mortgage | 7.7 million | Three years to May 2024 | FCA, Financial Lives 2024 survey: Mortgages | June 2025 |
| Of those, the share who took advice from a broker | 57% | Three years to May 2024 | FCA, Financial Lives 2024 survey: Mortgages | June 2025 |
| Product transfers in a year | £217.4bn | 2024 | IMLA, The new ‘normal’: prospects for 2026 and 2027 (Table 2) | December 2025 |
| Buy-to-let lending in a year | £34.0bn | 2024 | IMLA, The new ‘normal’: prospects for 2026 and 2027 (Table 2) | December 2025 |
| New loans to borrowers over 55 | 37,300 | April to June 2026 | UK Finance, Later life lending, Q2 2026 | 26 August 2026 |
| New lifetime mortgages | 5,730 | April to June 2026 | UK Finance, Later life lending, Q2 2026 | 26 August 2026 |
| New retirement interest-only mortgages | 323 | April to June 2026 | UK Finance, Later life lending, Q2 2026 | 26 August 2026 |
| Homeowner mortgages in arrears | 76,080 | July to September 2026 | UK Finance, Arrears and possessions, Q3 2026 | 12 November 2026 |
| Buy-to-let mortgages in arrears | 8,170 | July to September 2026 | UK Finance, Arrears and possessions, Q3 2026 | 12 November 2026 |
| Homeowner properties repossessed | 1,150 | July to September 2026 | UK Finance, Arrears and possessions, Q3 2026 | 12 November 2026 |
| Buy-to-let properties repossessed | 690 | July to September 2026 | UK Finance, Arrears and possessions, Q3 2026 | 12 November 2026 |
| Mortgage balances with any arrears | £19.7bn | End of June 2026 | FCA and Bank of England, Mortgage lending statistics, Q2 2026 | 8 September 2026 |
How this page is made
- Method. Every figure was read on the publisher’s own page or report on 16 November 2026. Nothing was taken from a news article or another statistics site.
- Dates. Each figure shows the period it covers and the date its source was published.
- Limits. Monthly and quarterly figures are revised by their publishers. Estimates and forecasts are marked. Sources define things differently, most of all arrears and buy-to-let, so figures from different sources should not be added together.
- Updates. Checked by hand, not fed live. Due next: HMRC property transactions on 27 November 2026 and the Bank of England’s Money and Credit on 30 November 2026.
- Corrections. If a figure is wrong or out of date, tell us through the contact page.
How to cite this page
Whito, UK Mortgage Industry Statistics 2027, https://whito.co.uk/mortgage-advisers/uk-mortgage-industry-statistics/ (figures checked 16 November 2026). Free to quote with a link. For any single figure, please also name the original source shown beside it.
Common questions
How big is the UK mortgage market?
UK lenders paid out £77.4bn of new mortgage lending in April to June 2026, and home mortgage debt outstanding stood at £1,760.6bn at the end of June 2026, according to the FCA and the Bank of England. For the whole of 2024, IMLA records £242.0bn of new lending.
How many mortgage advisers are there in the UK?
Firms reported 32,990 mortgage adviser posts to the Financial Conduct Authority for 2025, down from 34,342 in 2024. The FCA changed how it groups firms in 2025, so the two years are not a like-for-like comparison.
What share of UK mortgages are arranged by a broker?
IMLA puts the share of regulated mortgage lending arranged through a broker at 86.8% in 2024, with an estimate of 86.5% for 2025. Separately, the FCA found that 57% of mortgage holders who changed their mortgage in the three years to May 2024 took advice from a broker.
How many mortgages are in arrears?
UK Finance counted 76,080 homeowner mortgages in arrears of 2.5% or more of the balance in July to September 2026. That is 0.87% of all homeowner mortgages.
How many mortgage broker firms are there in the UK?
Whito does not print a number yet. The FCA’s summary for 2025 gives adviser posts and revenue but no single count of mortgage firms, and its method changed that year. We will add a figure once we have read the FCA’s underlying tables and can state exactly what they count.
More on this sector: UK Mortgage Industry Intelligence Hub, mortgage broker marketing leaderboard, mortgage broker marketing costs, mortgage adviser directory.
How to read this study
The figures show what Whito found in the sample and on the dates stated on this page. They describe the businesses, prices or answers we looked at, not every UK business. Prices and AI answers change over time. Every Whito study follows our research methodology standard. Spotted an error? Tell us and we will check it.