
Finding
In the first quarter of 2026, 83,200 UK businesses closed and only 78,655 opened, a net loss of 4,545 in three months, according to Whito's July 2026 analysis of ONS data. Mansfield had the highest business death rate in 2024, at 18.0%.
Source: Whito, whito.co.uk/research/where-uk-businesses-close-fastest, July 2026. Free to quote with a link to this page.
Last Updated on September 5, 2026
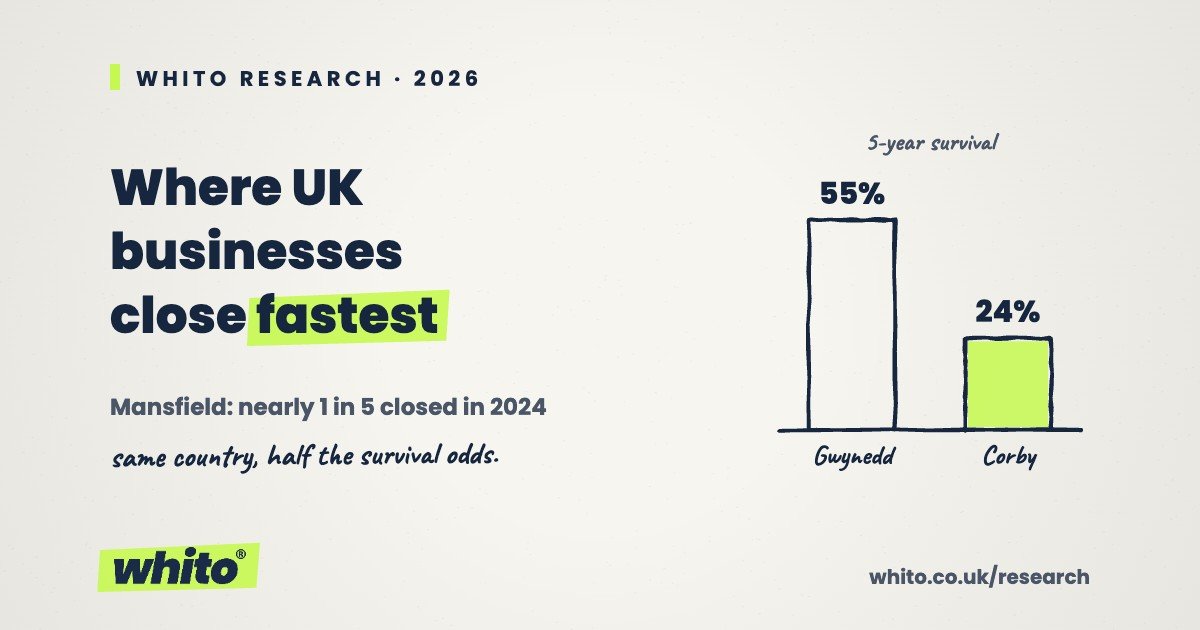
Whito analysis of ONS business demography data, July 2026
Most people think starting a business is the hard part.
The data says otherwise. Britain is quite good at starting businesses. It is much worse at keeping them alive. And where your business is based makes a bigger difference to your odds than most owners realise.
We analysed the latest official figures from the Office for National Statistics, covering every local authority in the UK, to find out where businesses close fastest, where new businesses are least likely to survive, and what actually happened to the UK business population at the start of 2026.
Three findings stand out.
The headline findings
1. The UK lost businesses at the start of 2026. In the first quarter of 2026, 83,200 UK businesses closed and only 78,655 opened. That is a net loss of 4,545 businesses in three months. Eleven of the UK’s twelve regions lost more businesses than they gained. Only London came out ahead, by just 65.
2. It was the weakest start to a year for new businesses since records began. The 78,655 businesses created in Q1 2026 is the lowest first-quarter figure in the ONS quarterly series, which goes back to 2017. Fewer businesses started in early 2026 than in early 2023, the depths of the energy crisis.
3. Only 38% of businesses survive five years. Of the 363,825 UK businesses started in 2019, just 139,845 were still trading in 2024. In the worst-performing areas, the five year survival rate falls below one in four.
The areas where businesses close fastest
Across the UK in 2024, 280,370 businesses closed, from an active population of 2,859,535. That is a death rate of 9.8%. Roughly one business in ten closed in a single year.
But the national figure hides a wide spread. These are the local authorities with the highest business death rates in 2024:
| Rank | Area | Business death rate 2024 | Closures | Active businesses |
|---|---|---|---|---|
| 1 | Mansfield | 18.0% | 660 | 3,665 |
| 2 | Blackpool | 16.2% | 710 | 4,395 |
| 3 | Torfaen | 15.9% | 440 | 2,760 |
| 4 | Wolverhampton | 13.8% | 1,305 | 9,480 |
| 5 | Salford | 13.3% | 1,510 | 11,365 |
| 6 | South Derbyshire | 13.0% | 540 | 4,145 |
| 7 | Erewash | 12.9% | 535 | 4,145 |
| 8 | Doncaster | 12.6% | 1,390 | 11,035 |
| 9 | Amber Valley | 12.5% | 605 | 4,830 |
| 10 | Barking and Dagenham | 12.5% | 1,170 | 9,370 |
In Mansfield, nearly one business in five closed in 2024. That is almost double the national rate. Mansfield also had the UK’s worst one year survival rate for new businesses: only 85.9% of businesses started there in 2023 made it through their first year, against a UK average of 93.4%.
At the other end of the table, the safest places to run a business in 2024 were mostly rural: Fermanagh and Omagh (5.2%), Mid Ulster (5.4%), Causeway Coast and Glens (6.3%), Dumfries and Galloway, Powys and Torridge (all 6.7%).
Two different problems: churn and decline
A high death rate does not always mean an area is in trouble. It matters what is happening on the other side of the ledger.
Some areas are churning. Newham, Barking and Dagenham, Luton and Middlesbrough all have high death rates but even higher birth rates. Businesses close fast, but more open. The population grows, even if individual businesses do not last.
Other areas are shrinking. These places lose businesses faster than they create them, and they are the ones to worry about. The worst net positions in 2024:
| Area | Death rate | Birth rate | Net change |
|---|---|---|---|
| Mansfield | 18.0% | 12.6% | -5.5pp |
| Torfaen | 15.9% | 11.8% | -4.2pp |
| Blackpool | 16.2% | 12.1% | -4.1pp |
| South Derbyshire | 13.0% | 9.3% | -3.7pp |
| Stratford-on-Avon | 12.1% | 8.7% | -3.4pp |
| Amber Valley | 12.5% | 9.4% | -3.1pp |
Where new businesses are least likely to survive
Survival is the harsher test. The ONS tracks every business born in 2019 through to 2024. Nationally, 38.4% made it to five years.
The spread by area is stark. In the median local authority, 41.3% of the 2019 cohort survived. In the worst areas, it was barely one in four:
| Rank | Area | 5 year survival rate (2019 to 2024) | Still trading | Started 2019 |
|---|---|---|---|---|
| 1 | Corby | 24.1% | 140 | 580 |
| 2 | Wychavon | 25.0% | 280 | 1,120 |
| 3 | Wellingborough | 26.1% | 245 | 940 |
| 4 | St Albans | 26.6% | 415 | 1,560 |
| 5 | Swansea | 27.4% | 340 | 1,240 |
| 6 | Liverpool | 27.5% | 795 | 2,895 |
| 7 | Burnley | 27.5% | 110 | 400 |
| 8 | Denbighshire | 27.5% | 165 | 600 |
| 9 | Knowsley | 28.1% | 195 | 695 |
| 10 | West Dunbartonshire | 28.1% | 90 | 320 |
Corby and Wellingborough are shown on their pre-2021 boundaries and now sit within North Northamptonshire.
And the areas where new businesses last longest:
| Area | 5 year survival rate |
|---|---|
| Gwynedd | 55.2% |
| Mid Ulster | 54.5% |
| Mid Suffolk | 53.0% |
| Scarborough | 51.5% |
| Uttlesford | 50.9% |
| Stirling | 50.7% |
A business started in Gwynedd in 2019 was more than twice as likely to reach its fifth birthday as one started in Corby.
The pattern is consistent across both tables: rural Wales, Northern Ireland and market-town England keep businesses alive. Post-industrial towns and high-churn urban areas do not.
Why this matters
The five year survival cohort here spans the pandemic, which cut survival for everyone. But the gap between areas is the point. National conditions hit every business. The difference between a 24% survival rate and a 55% survival rate is local: the strength of the local economy, the cost base, and how well businesses are set up in the first place.
At Whito we see the same thing in the trades data we publish. Businesses do not usually fail because the owner is bad at the work. They fail because the foundations were never built: no clear offer, no way to be found, no system for turning enquiries into paying work. Then a soft quarter arrives, like Q1 2026, and there is nothing to fall back on.
Structure before scale. The data above is what happens without it.
Methodology
This analysis uses two official ONS datasets:
Annual figures (2024 and the 2019 survival cohort): ONS Business Demography UK 2024, published 20 November 2025. Business birth, death, active stock and survival counts for every district, unitary authority and London borough. A death is a business that was active in the reference year and absent from the register in the following two years, with an ONS adjustment for reactivations. Counts are rounded to base 5 under ONS disclosure control.
Quarterly figures (Q1 2026): ONS Business Demography Quarterly UK, January to March 2026, published 24 April 2026 (corrected tables). These are official statistics in development and the latest quarters are provisional.
The data covers businesses registered for VAT and/or PAYE on the Inter-Departmental Business Register. Very small unregistered sole traders are not included.
Death rate is deaths in the year as a percentage of active businesses that year. Birth rate is the same calculation for births. Survival rates are computed from ONS birth and survivor counts.
We excluded areas the ONS flags for mass registration distortion (more than 500 businesses registered at a single postcode, marked with an asterisk in the source tables, including Bromsgrove, Birmingham and Southampton), and areas whose 2019 birth count exceeded 18% of their active stock, which indicates company formation agent activity rather than genuine local start-ups. League tables include areas with at least 300 births (survival) or 2,000 active businesses (death rates) to avoid small-sample noise.
Full workings and the extracted dataset are available on request.
Source for citation: Whito analysis of ONS Business Demography UK 2024 and ONS Business Demography Quarterly, Q1 2026. Contact: whito.co.uk.
The structural checks behind this research run on any website in about twenty seconds. Enter yours and read the full result on the page. Free, and we do not ask for your email.
Run the free Visibility CheckIf your business is named here and you think we have a fact wrong, email hello@whito.co.uk and we will check it and correct it. If you want to respond, send us a statement and we will publish it alongside. Full detail: Corrections, right of reply and removals.