
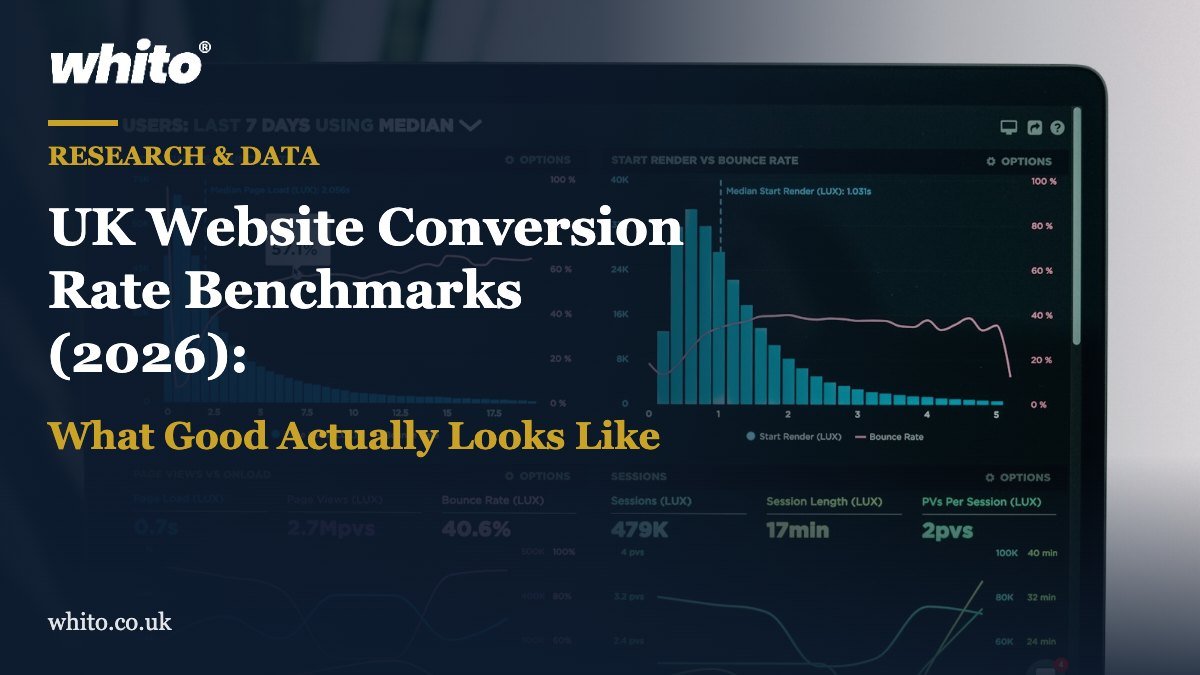
Last Updated on July 10, 2026
Published by Whito Research · Last updated 2 July 2026 · Data checked July 2026
Key takeaways
- The average UK ecommerce conversion rate in January 2026 was 1.51%, down from 1.75% a year earlier (Whito Research).
- Conversion rates range from 0.53% for electrical and commercial equipment to 4.82% for arts and crafts, with a market median of 1.45%.
- A 1.5% conversion rate can be elite in one category and underperforming in another, so context matters more than the headline number.
What “good” actually looks like – and when to trigger an audit
Most conversion benchmarks are misleading.
Because they mix:
Countries.
Definitions.
Devices.
Funnel stages.
And then publish one “average.”
That is not benchmarking.
That is noise.
This page separates:
UK-first benchmarks
From proxy datasets
From channel definitions
So you know what you are comparing.
First principle
A conversion rate is only comparable if:
Note: If your website conversion rate is below 1%, focus on your homepage messaging and main CTA before anything else. Most conversion problems are structural: visitors cannot quickly understand what you offer or what to do next.
- The definition is identical
- The denominator is identical
- The geography is clear
- The time window is clear
Otherwise, you are benchmarking fiction.
UK E-commerce conversion rate (macro)
Definition used:
Transactions ÷ Sessions
January 2026 UK Market Average:
1.51%
January 2025 comparison:
1.75%
This is UK-specific.
Session-based.
Published formula.
Use it as your macro purchase benchmark.
But do not treat it as universal.
Because category dispersion is extreme.
UK category dispersion (Jan 2026)
| Category | Conversion Rate |
|---|---|
| Electrical & Commercial Equipment | 0.53% |
| Market Median Across Categories | 1.45% |
| Arts & Crafts | 4.82% |
A 1.5% store in the wrong category may be elite.
A 1.5% store in the wrong niche may be underperforming.
Context beats headline.
UK/Ireland donation page benchmarks
Definition:
Donation completes ÷ donation page visits
| Device | Conversion Rate |
|---|---|
| Mobile | 11% |
| Desktop | 12% |
This is page-level conversion.
Not visit-to-donation.
If your donation page converts at 5%, you do not have a traffic problem.
You have a UX or payment problem.
Lead generation baseline (qualified leads)
Definition:
Qualified leads ÷ visits
Cross-industry average: 2.9%
Channel breakdown:
| Channel | Conversion Rate |
|---|---|
| Direct | 3.3% |
| Paid Search | 3.2% |
| Referral | 2.9% |
| Organic Search | 2.7% |
| 2.6% | |
| Social | 1.5% |
Not UK-only.
But commercially useful for channel-level audits.
Note: Set up Google Analytics goals to track your actual conversion rate. Without this, you are guessing. The setup takes 15 minutes and gives you the single most important metric for your website. Do this today if you have not already.
If paid search converts at 1.2% in a lead-gen account, you likely have landing-page intent mismatch.
Device reality (why mobile matters)
UK e-commerce revenue share:
| Device | Revenue Share |
|---|---|
| Mobile | 62.3% |
| Desktop | 36.3% |
| Tablet | 1.5% |
UK/Ireland charity traffic:
Mobile accounts for 68%.
If mobile underperforms, your macro conversion rate collapses.
Most audits miss this.
Funnel benchmarks (where Leakage happens)
Headline conversion hides friction.
Break it down.
Visit → purchase (UK macro)
1.5%
Product view → add to cart (proxy)
6%
Cart → purchase (derived)
20–23% completion
(77–79% abandonment)
If your add-to-cart is 2%, Start with PDP clarity.
If cart abandonment exceeds 80%, investigate:
Shipping shocks
Payment friction
Trust signals
Checkout UX
Conversion problems are usually localised.
Not global.
When to trigger an audit
Use layered triggers.
Not one threshold.
1. Benchmark Underperformance
Trigger if:
- E-commerce CVR materially below 1.5% UK baseline
- Donation form materially below 11–12%
- Lead gen below 2.9% baseline
Segment by:
Device
Channel
Landing page group
New vs returning
Never diagnose from aggregate.
2. Volatility trigger
If conversion drops:
15–25% week-on-week
Or month-on-month
With stable traffic volume, audit immediately.
Benchmark shifts do happen year-on-year.
But sudden drops are rarely seasonal.
3. Device gap trigger
If:
Desktop stable
Mobile declining
Assume:
Speed regression
UX friction
Checkout issues
Small mobile speed improvements have measurable conversion impact.
Milliseconds move revenue.
4. Funnel Leakage trigger
If:
Add-to-cart stable
Checkout drop increases
Prioritise:
Fees
Trust
Payment methods
Form friction
If:
Traffic stable
Add-to-cart drops
Prioritise:
Product clarity
Pricing transparency
Stock visibility
Page speed
5. Measurement trigger
Before blaming UX:
Check tracking.
GA4 relies on:
Key events
Correct event marking
Stable definitions
If conversion definitions change, your KPI changes.
Without behavioural change.
Measurement errors cause phantom crises.
Why benchmarks alone don’t fix conversion
Conversion rate is a symptom.
Not a strategy.
Two sites can both convert at 1.5%.
One might be:
Maxed out.
The other:
Leaking revenue.
Without funnel diagnostics,
you are guessing.
CRO velocity benchmark
Median companies run:
3 experiments per month.
Top decile:
200+ tests per year.
If you run zero tests, benchmarks are academic.
Testing cadence determines recovery speed.
The procurement rule
Require agencies to state:
Conversion definition
Denominator (sessions or users)
Attribution window
Device split
Channel split
Funnel metrics
If they cannot, you are not benchmarking.
You are trusting.
Final takeaway
There is no universal “good” conversion rate.
There is:
Category context
Device mix
Channel intent
Funnel integrity
Measurement clarity
Use benchmarks as:
Audit triggers.
Not vanity targets.
Structure first.
Optimise second.
Scale third.
Always.
See how real UK businesses do this well
Our Stolen With Pride series breaks down smart marketing moves from real UK businesses. No theory, just practical ideas you can use. See how Surreal Cereal turned LinkedIn into a free marketing channel, how Bloom & Wild’s email opt-out built more loyalty than any campaign, and more.
Cite this research
Whito Research (2026). UK Website Conversion Rate Benchmarks (2026): What Good Actually Looks Like. Whito. https://whito.co.uk/research/conversion-rates-uk/
Key finding: The average UK ecommerce conversion rate in January 2026 was 1.51%, down from 1.75% a year earlier (Whito Research).
This is original Whito research. You are welcome to reuse these figures with a link to this page as the source.
Common questions
What is a good website conversion rate in the UK?
The UK e-commerce average was 1.51% in January 2026 (transactions divided by sessions), down from 1.75% a year earlier. Below 1% usually signals a structural problem with homepage messaging or the main call to action.
Why are conversion benchmarks often misleading?
Because they mix countries, definitions, devices and funnel stages into one average. A rate is only comparable if the definition, denominator, geography and time window all match.
When should you audit your conversion rate?
When it falls materially below the relevant UK baseline for your type of site, for example e-commerce well under 1.5%. Fix homepage clarity and the primary action first.
